Has Draft Kings ($DKNG) bottomed and ready to rally?

Good day Traders and Investors. In today’s article, we are going to follow up on Draft Kings ($DKNG) forecast posted back in January 2022 and take a look at the latest Daily count.
“DraftKings is an American daily fantasy sports contest and sports betting provider. The company allows users to enter daily and weekly fantasy sports–related contests and win money based on individual player and team performances in five major American sports (MLB, the NHL, the NFL, the NBA and the PGA), Premier League and UEFA Champions League soccer, NASCAR auto racing, Canadian Football League, the XFL, Mixed martial arts (MMA) and Tennis.””
Draft Kings Elliott Wave latest view (daily)
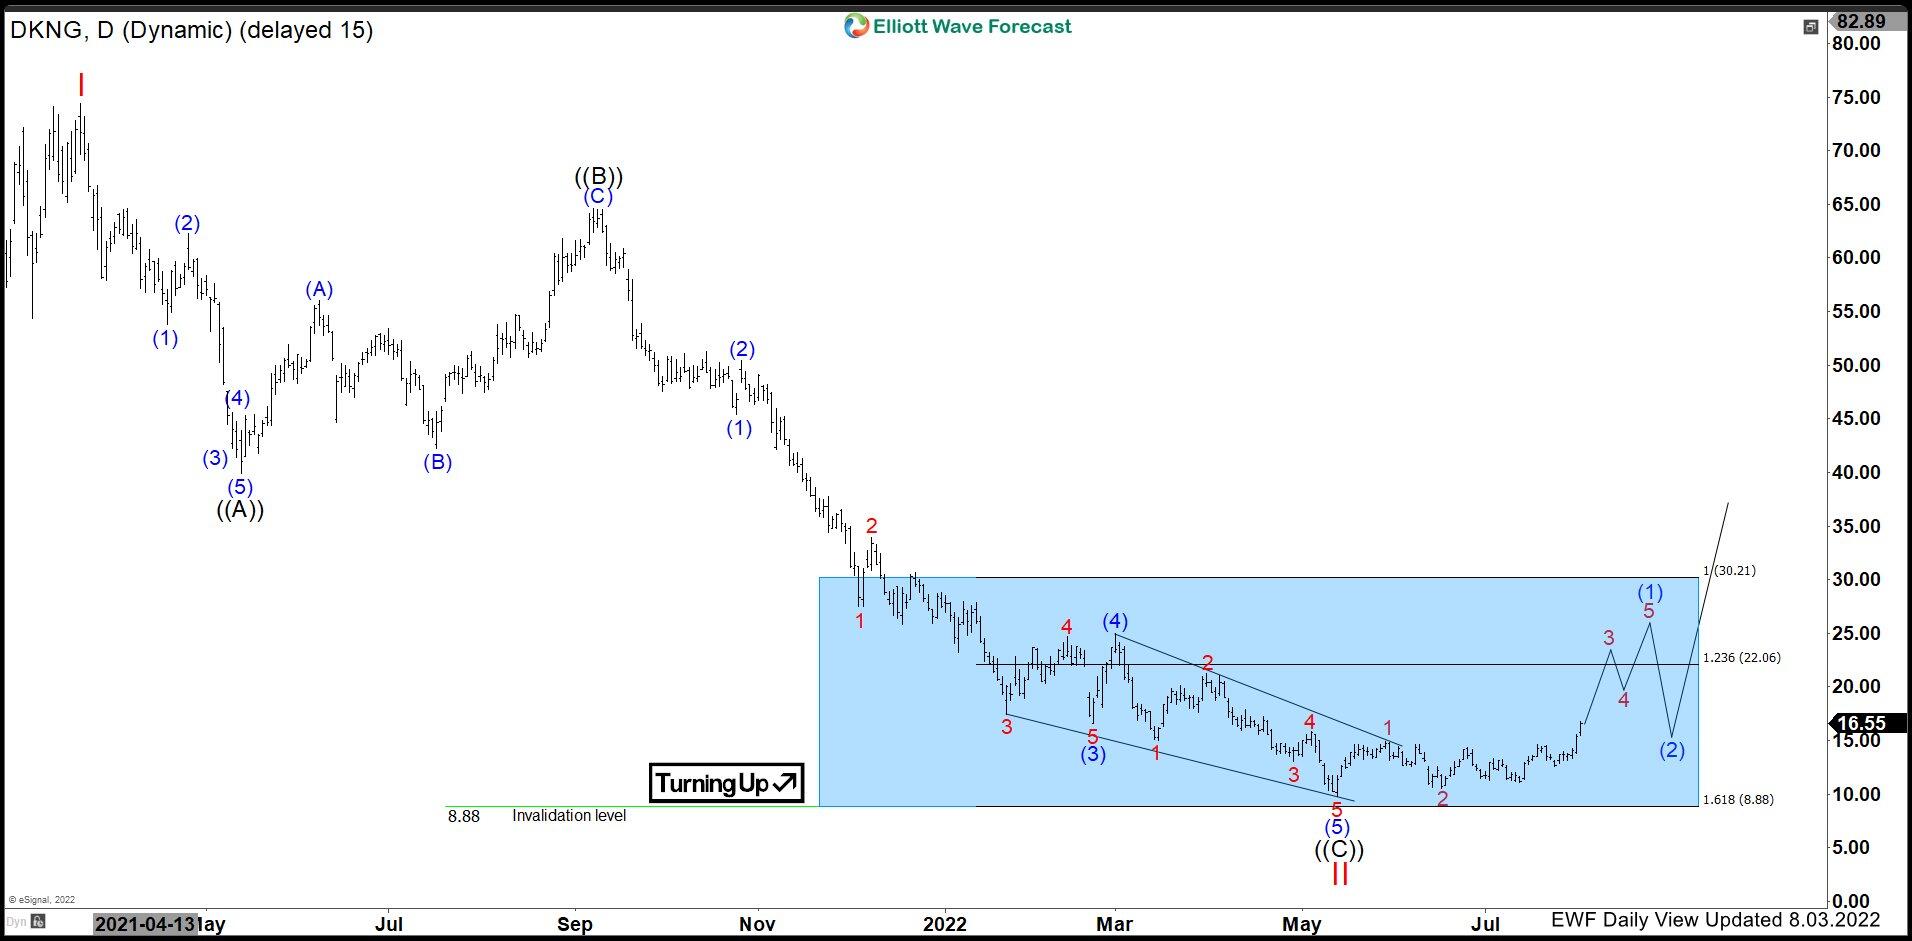
Draft kings peaked at $74.38 back in March 22, 2021 at red I and started the decline to correct cycle against all time lows. The initial ((A)) wave down is favoured to be in 5 waves, with a 3 wave reaction into ((B)). ((B)) peaked in September 2021. After ((B)) peaked, the stock unfolded into another impulse lower in an extended ((C)) wave. Momentum has been diverging on the Daily which is the case in an ending diagonal in wave (5). It managed to extend deep into the Blue Box area but found buyers on May 12, 2022 at $9.77. Since May 12, 2022, the stock has been making progress bouncing in a series of 5 waves and is favoured to be nesting. Momentum is also picking up and is breaking previous pivots on the Daily timeframe.
In conclusion, as long as it remains above the invalidation level at $8.88, it should continue higher. The stock is only turning up and any trades in the blue box would be against $8.88. We don’t like to sell it short down here in the blue box as that would be high risk.
Draft Kings Elliott Wave alternative view (Daily)
What about the alternative view? We at Elliottwave Forecast look at all the possibilities and try to educate our members on alternative counts. The Daily Chart above shows the alternative view on $DKNG. It can be unfolding in an expanded flat structure from October 2020 high. This view favours that the stock found a low on May 12, 2022 at ((3)) and ended a cycle from ((2)). It can be bouncing in 3, 7 or 11 swings to correct cycle against $64.58 before the next leg lower in ((5)) takes place.
Author

Elliott Wave Forecast Team
ElliottWave-Forecast.com


