GX Uranium ETF Elliott Wave technical analysis [Video]
![GX Uranium ETF Elliott Wave technical analysis [Video]](https://editorial.fxstreet.com/images/Markets/Equities/DowJones/bloomberg-app-on-iphone-4-with-market-data-17118657_XtraLarge.jpg)
GX Uranium ETF commodity Elliott Wave analysis
The GX URA ETF, also known as the Global X Uranium ETF, tracks the performance of companies in the uranium industry. This ETF offers investors a diversified portfolio that includes firms involved in uranium mining, exploration, and production worldwide. As nuclear power gains recognition as a cleaner energy alternative, the demand for uranium is expected to rise, making the GX URA ETF an attractive option for investors looking to benefit from the sector's growth.
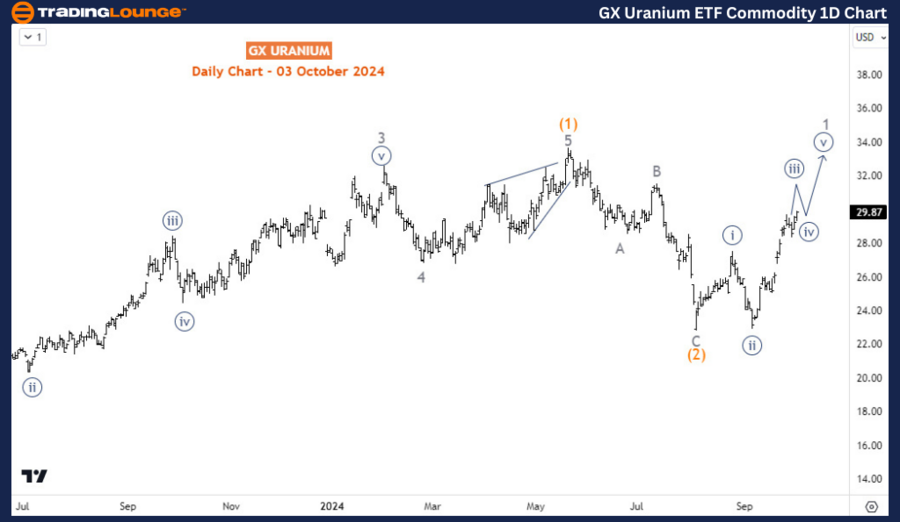
Price completed the bearish corrective cycle from May 2024 in August of the same year and the commodity has followed with rapid rallies to confirm it’s in another bullish phase. The commodity is now expected to extend above the May 2024 high to reach its highest price in over a decade.
Long term analysis
From the long-term view, GX URA appears to be in a bullish corrective cycle. Between February 2011 to March 2020, the ETF fell consistently making lower lows and lower highs reminiscent of an impulse wave structure. price has been correcting the long-term bearish run since the low of March 2020. From March 2020, the price completed an impulse wave sequence for wave A (circled) of the primary degree in November 2021. Afterward, it made a corrective pullback for wave B (circled) which ended in July 2022. From there an impulse wave was completed for wave (1) of C (circled) in May 2024 and a pullback followed for wave (2) as the daily chart shows. The current rally from the 5th of August 2024 is expected to be wave 1 of (3). Wave 1 is incomplete. Thus, there is a lot of room for buyers to keep pushing the long-term recovery.
H4 chart analysis
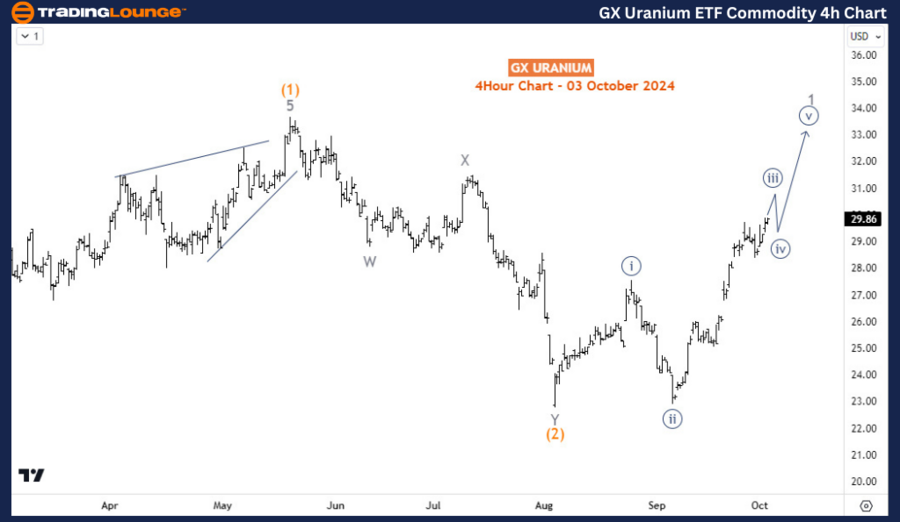
On the H4 chart, the price is currently in wave ((iii)) of 1 and could extend higher before pullback for ((iv)) where buyers will like to buy again. Traders can look for buying opportunities from the dip when the price completes wave ((iv)) or wave 2 in the near term.
Technical Analyst: Sanmi Adeagbo.
GX Uranium ETF commodity Elliott Wave analysis [Vidoe]
Author

Peter Mathers
TradingLounge
Peter Mathers started actively trading in 1982. He began his career at Hoei and Shoin, a Japanese futures trading company.


