|

Goldman Sachs (GS) should continue rally after dropping to a blue box

The Goldman Sachs Group, Inc. (GS) is an American multinational investment bank and financial services company headquartered in New York City. It offers services in investment management, securities, asset management, prime brokerage, and securities underwriting. The company invests in and arranges financing for startups, and in many cases gets additional business when the companies launch initial public offerings. Notable initial public offerings for which Goldman Sachs was the lead bookrunner include those of Twitter, Bumble, Robinhood Markets, Coupang, etc.

Goldman Sachs (GS) June daily chart

GS

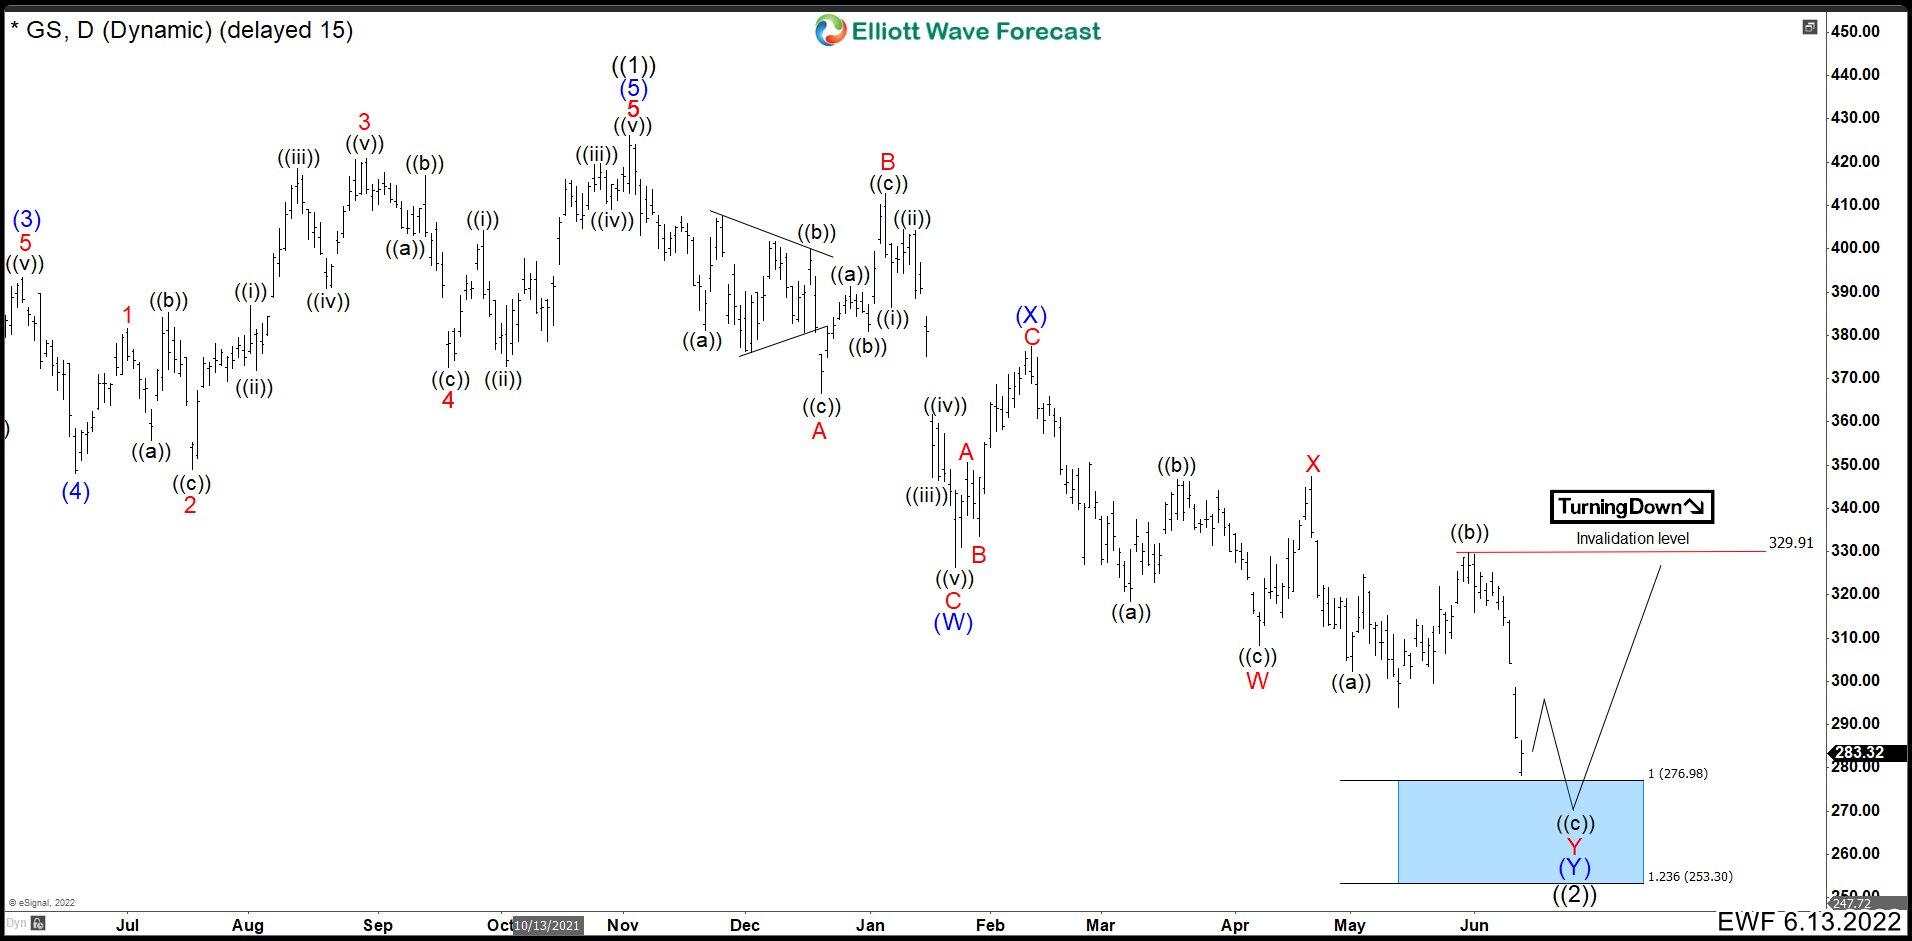
In June, we were looking to finish the cycle correction that started in March 2020. The March cycle built momentum which we call wave ((1)) and ended at 426.39. The pullback took the form of a double correction. At the end, GS needed one more low towards the blue box area in 276.98 – 253.30 to complete the wave ((2)). From here, we expected to continue the bullish trend. (If you want to learn more about double correction or Elliott Wave Theory, follow these links: Elliott Wave Education and Elliott Wave Theory). The Rally continue higher than expected; therefore, we have adjusted the count labelling wave (1) higher as we show in the next chart.

GS

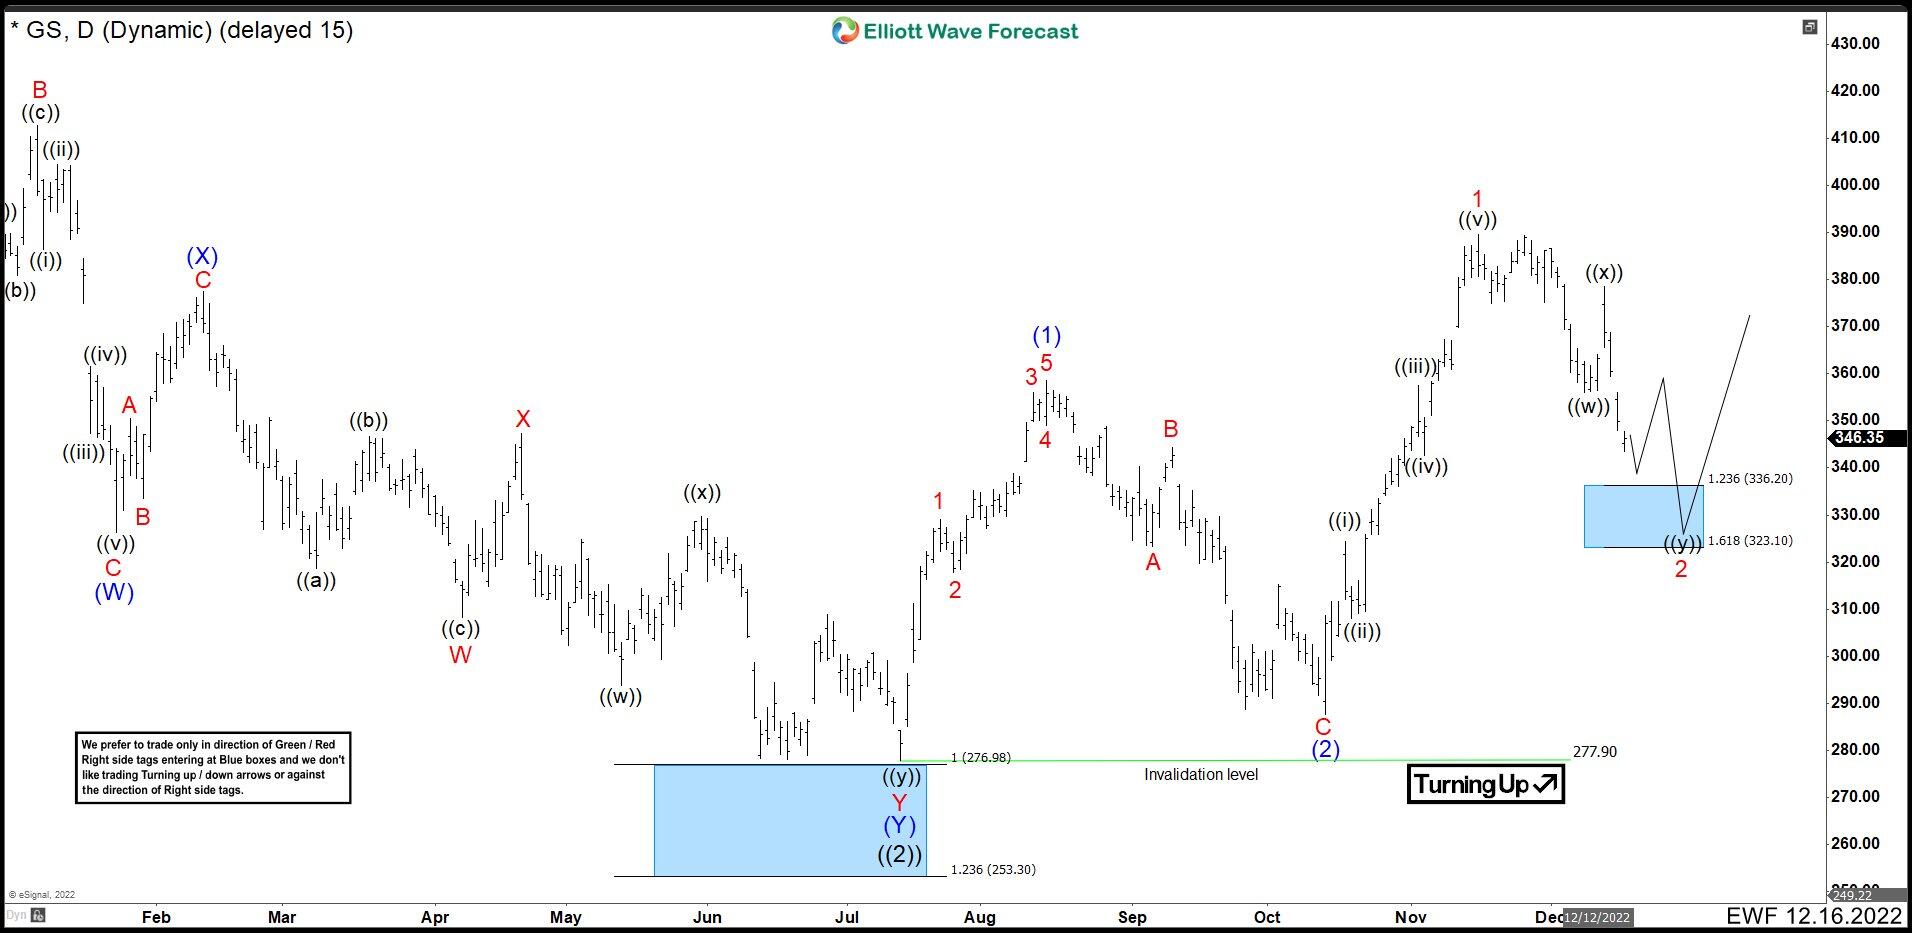
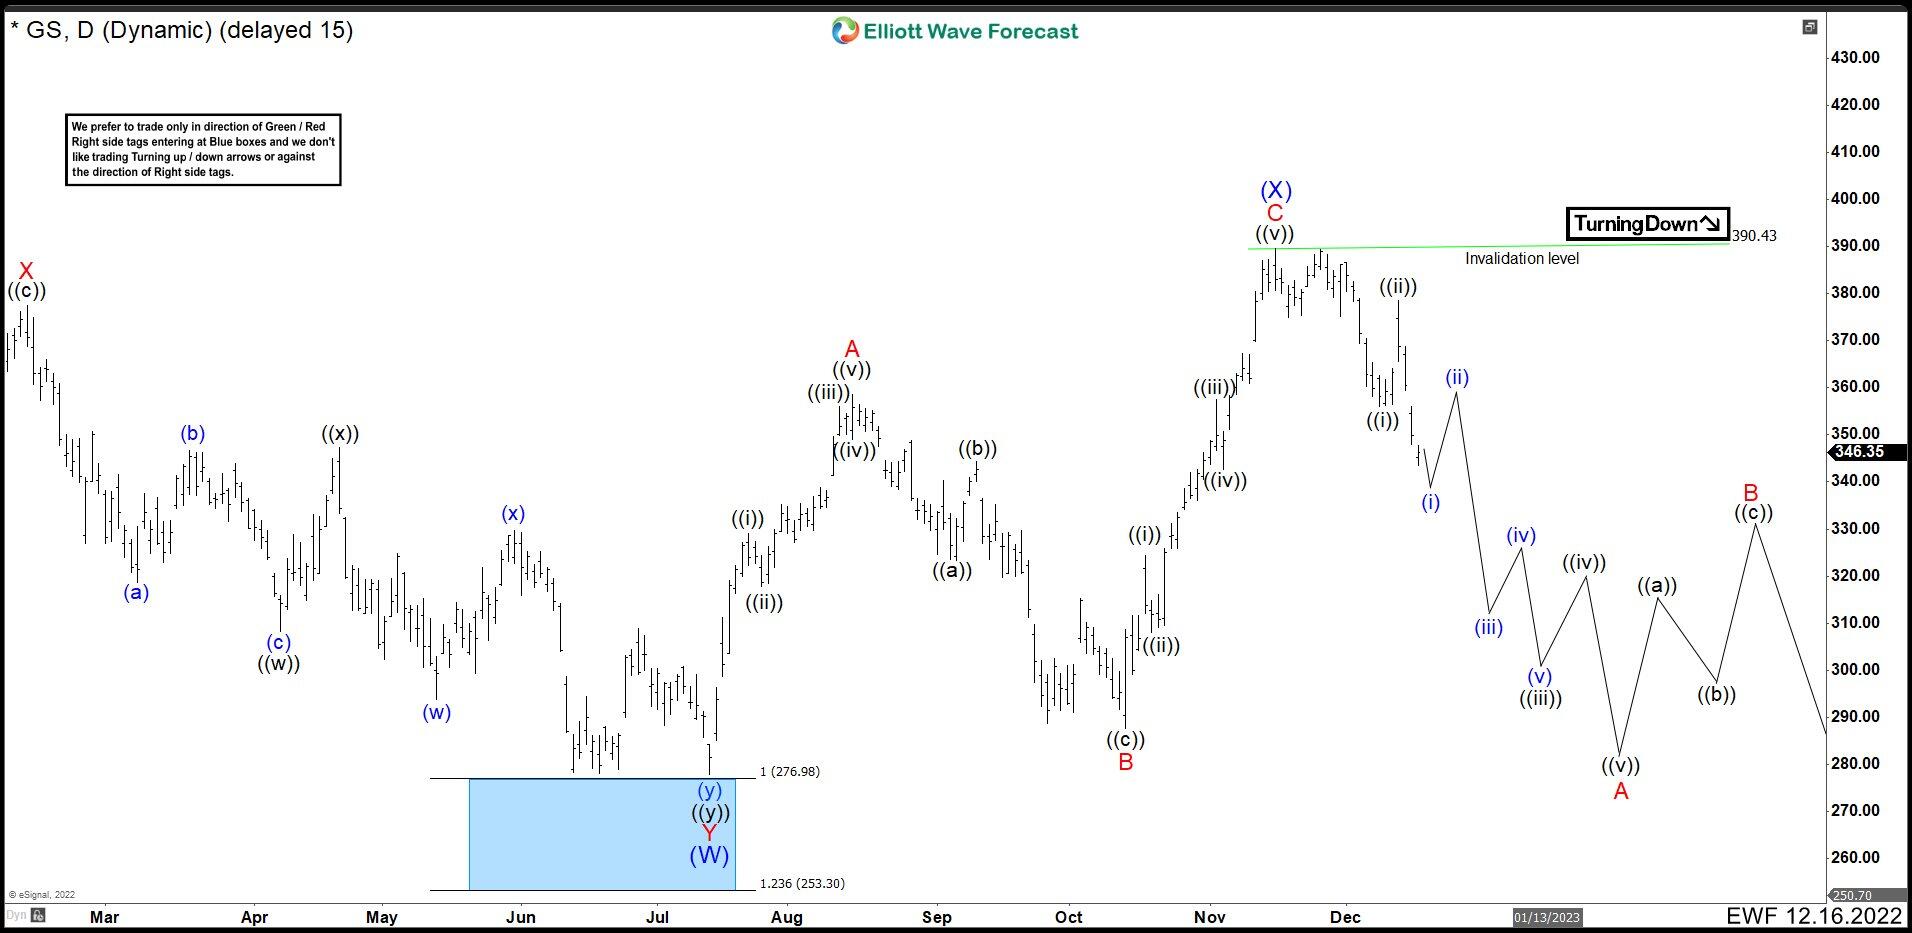
The saw a new low, but unfortunately it was very slight and it did not reach the blue box for a few cents. Wave ((2)) ended at 277.90. The rally continues and we can see 5 waves to the upside that ended at 358.52. We call this rally wave (1). We then got a very deep zig zag pullback that was close to breaking through the invalidation level. Wave (2) ended at 287.61 seeing a strong rebound again. This bounce formed another impulsive structure that ended at 389.51 and we call it wave 1. We expect the structure from the bottom of wave ((2)) to be a nest, which means that the current correction should remain above wave (2) to be valid. We expect a double correction as wave 2 to finish in the blue box at 336.20 – 323.10 and GS to continue higher.

Goldman Sachs (GS) December ALT daily chart

GS

Author

Elliott Wave Forecast Team

Elliott Wave Forecast Team

ElliottWave-Forecast.com

More from Elliott Wave Forecast Team
Share:

Markets move fast. We move first.

Orange Juice Newsletter brings you expert driven insights - not headlines. Every day on your inbox.

By subscribing you agree to our Terms and conditions.

Editor's Picks

EUR/USD flat lines near 1.1750 ahead of ECB policy decision

EUR/USD remains flat after two down days, trading around 1.1750 in the European session on Thursday. Traders move to the sidelines and refrain from placing any fresh directional bets on the pair ahead of the ECB policy announcements and the US CPI inflation data. 

GBP/USD stays defensive below 1.3400, awaits BoE and US CPI

GBP/USD oscillates in a narrow band below 1.3400 in European trading on Thursday. The pair trades with caution as markets eagerly await the BoE policy verdict and US consumer inflation data for fresh directional impetus. 

Gold awaits weekly trading range breakout ahead of US CPI report

Gold struggles to capitalize on the previous day's move higher back closer to the $4,350 level and trades with a mild negative bias during the Asian session on Thursday. The downtick could be attributed to some profit-taking amid a US Dollar uptick, though it is likely to remain cushioned on the back of a supportive fundamental backdrop. 

BoE set to resume easing cycle, trimming interest rate to 3.75%

The Bank of England will announce its last monetary policy decision of 2025 on Thursday at 12:00 GMT. The market prices a 25-basis-point rate cut, which would leave the BoE’s Bank Rate at 3.75%.

US CPI data expected to show inflation rose slightly to 3.1%, cooling Fed rate cut bets for January

The US Bureau of Labor Statistics will publish the all-important Consumer Price Index (CPI) data for November on Thursday at 13:30 GMT. The CPI inflation in the US is expected to rise at an annual rate of 3.1% in November

Dogecoin Price Forecast: DOGE breaks key support amid declining investor confidence

Dogecoin (DOGE) trades in the red on Thursday, following a 4% decline on the previous day. The DOGE supply in profit declines as large wallet investors trim their portfolios. Derivatives data shows a surge in bearish positions amid declining retail interest.