|

Gold technical analysis: Yellow metal is capped below $1,346.00/oz

  • Gold seems to have run out of steam below 1,346.00
  • A break below 1,320.00 would confirm the bearish case.
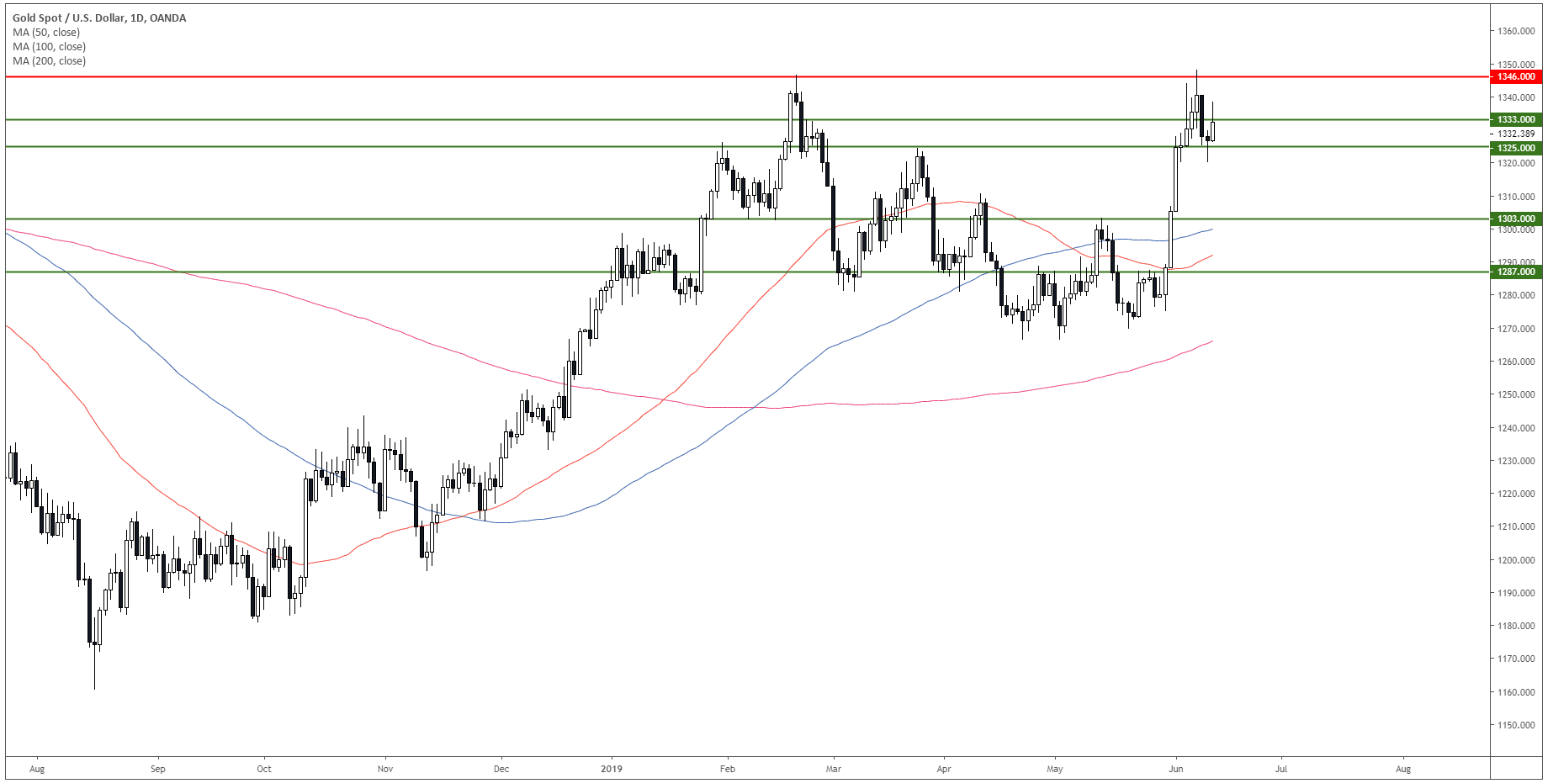
Gold daily chart

Gold is consolidating the recent gains below the 1,346.00 resistance.
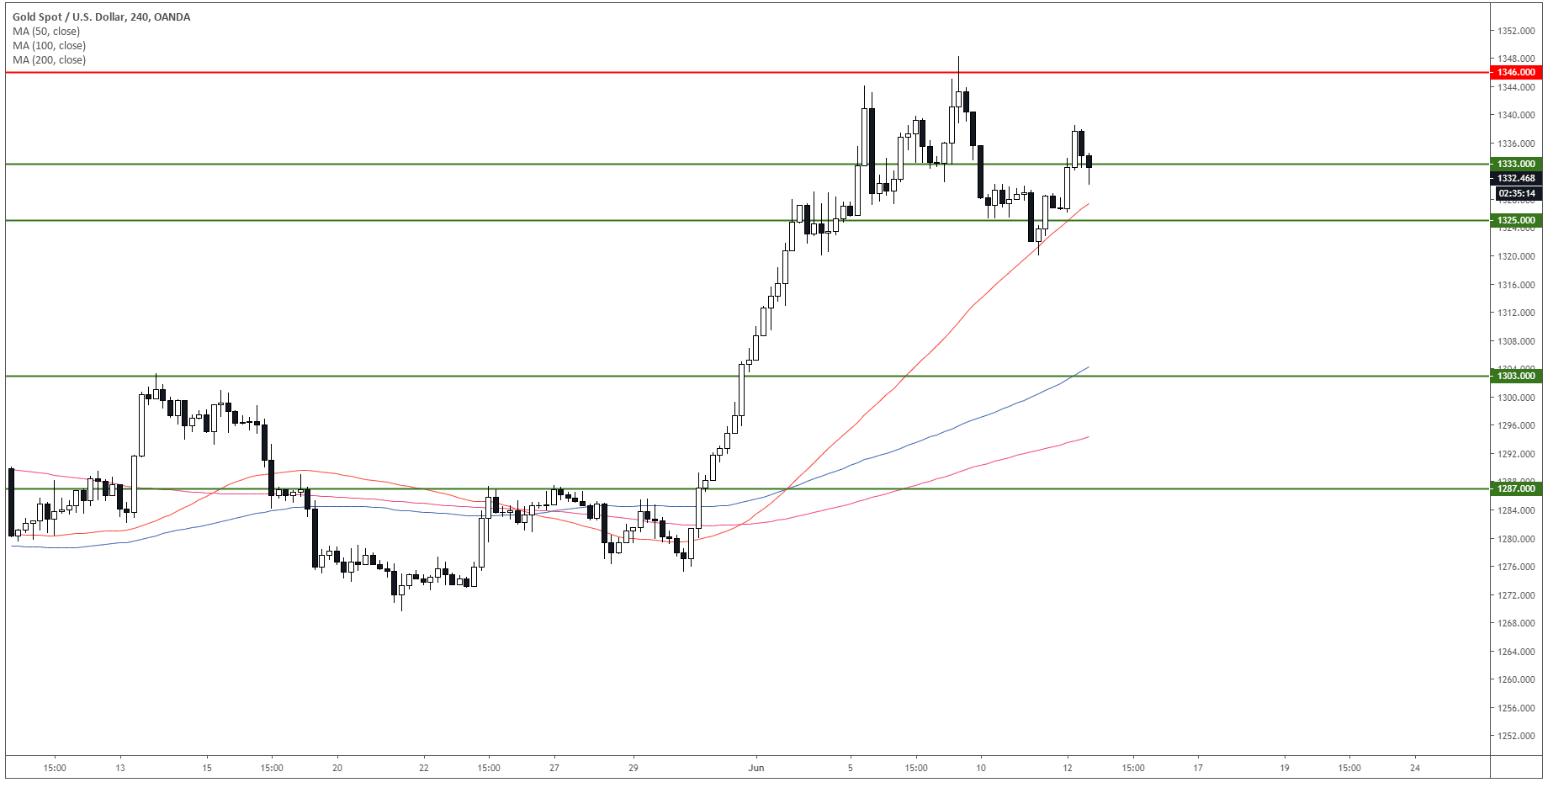

Gold 4-hour chart


Gold is trading above its main simple moving averages (SMAs) suggesting bullish pressure in the near term.

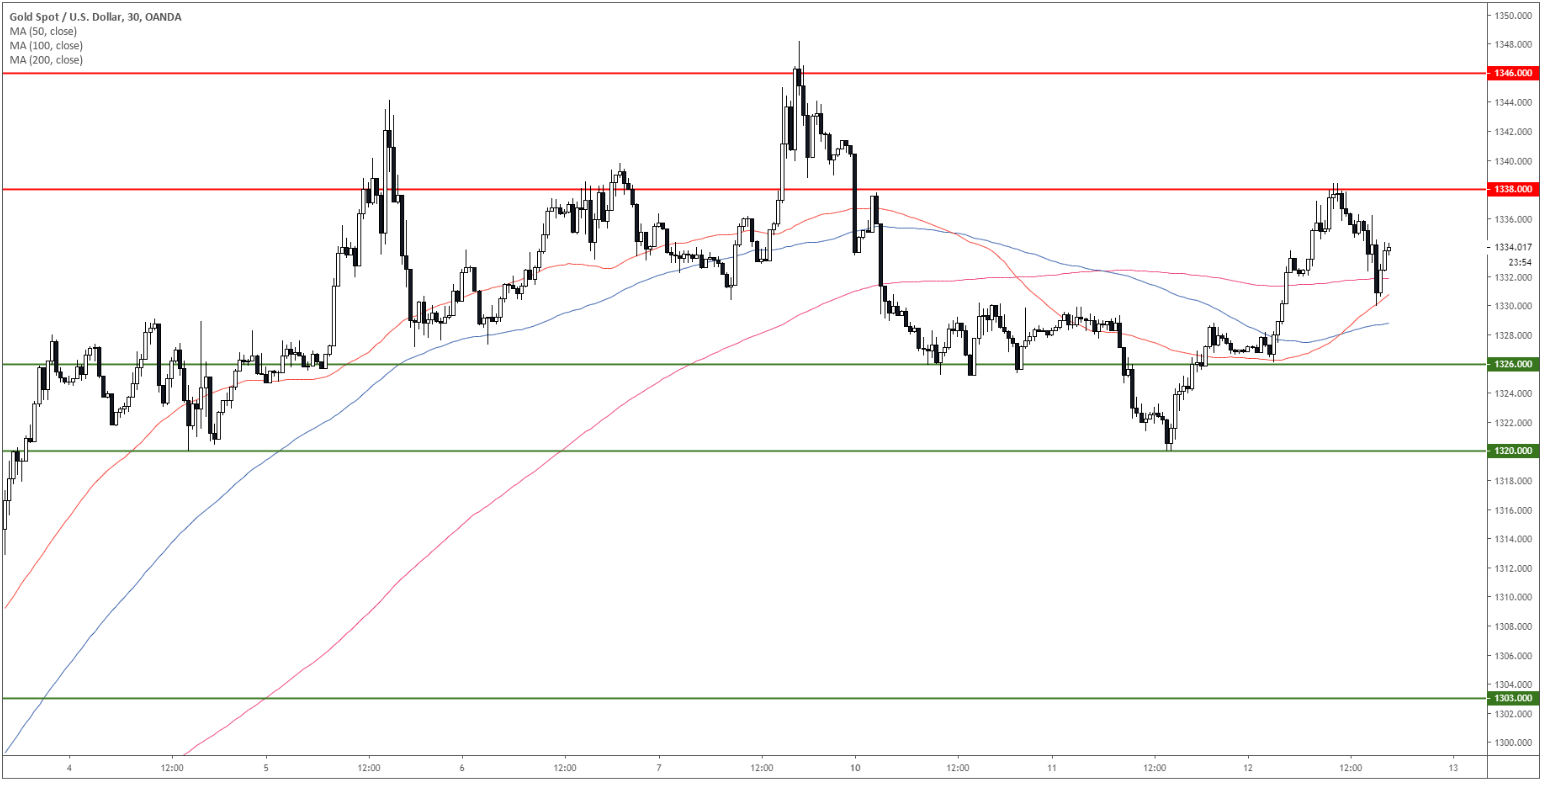
Gold 30-minute chart

Bulls will attempt to regain 1,338.00 to climb up to 1,346.00 resistance. On the flip side, sellers can try to break below 1,326.00 and 1,320.00 support to travel south near 1,303.00.

Additional key levels

XAU/USD

Overview
Today last price1333.92
Today Daily Change7.02
Today Daily Change %0.53
Today daily open1326.9
 
Trends
Daily SMA201300.1
Daily SMA501291.23
Daily SMA1001299.59
Daily SMA2001266.68
Levels
Previous Daily High1329.92
Previous Daily Low1319.99
Previous Weekly High1348.12
Previous Weekly Low1306.18
Previous Monthly High1306.9
Previous Monthly Low1266.35
Daily Fibonacci 38.2%1323.78
Daily Fibonacci 61.8%1326.12
Daily Pivot Point S11321.29
Daily Pivot Point S21315.68
Daily Pivot Point S31311.37
Daily Pivot Point R11331.22
Daily Pivot Point R21335.53
Daily Pivot Point R31341.14

Author

Flavio Tosti

Flavio Tosti

Independent Analyst


More from Flavio Tosti
Share:

Editor's Picks

EUR/USD risks a deeper drop below 1.1750

EUR/USD keeps its vacillating mood in place as the the NA session drwas to a close on Tuesday, hovering below the 1.1800 hurdle amid acceptable gains in the US Dollar. In the meantime, market participants and the FX galaxy are expected to closely follow President Trump’s SOTU speech around 2AM GMT.
 

GBP/USD regains 1.3500 and above

GBP/USD extends its advance for the third day in a row on Tuesday, this time retesting the area beyond the 1.3500 hurdle. Cable’s uptick comes despite decent gains in the Greenback and the dovish message from the BoE’s Bailey at the UK Parliament.

Gold appears offered around $5,150

Gold is giving back a good portion of the recent multi-day rally, receding to the $5,150 zone per troy ounce amid the decent bounce in the US Dollar and mixed US Treasuty yields. In the meantime, markets’ attention remain on upcoming comments from Fed speakers.

Ripple’s DeFi shift in focus: Navigating XRPL EVM sidechain growth, XRPFi migration and liquidity
Ripple (XRP) has continued to trade under pressure, extending its decline by approximately 63% from the record high of $3.66 in July. The remittance token is trading above support at $1.35, while its upside appears limited by key supply zones, starting with $1.40, at the time of writing on Tuesday.
The Citrini report: How a debatable AI narrative can shake Wall Street

That AI-related headline alone was enough to rattle investors.US stocks slid sharply on Monday after a widely circulated Citrini Research memo outlined a hypothetical “2028 Global Intelligence Crisis”, warning that rapid AI adoption could push US unemployment into double digits as early as by mid-2028.

XRP pressured by weak ETF flows and declining retail interest

Ripple (XRP) is edging lower, trading above its intraday low of $1.32 at the time of writing on Tuesday. The decline from its weekly opening of $1.39 reflects heightened volatility in the broader cryptocurrency market, accentuated by tariff-triggered uncertainty.