|
Gold Technical Analysis: Yellow Metal bears en route towards $1,247.00/oz

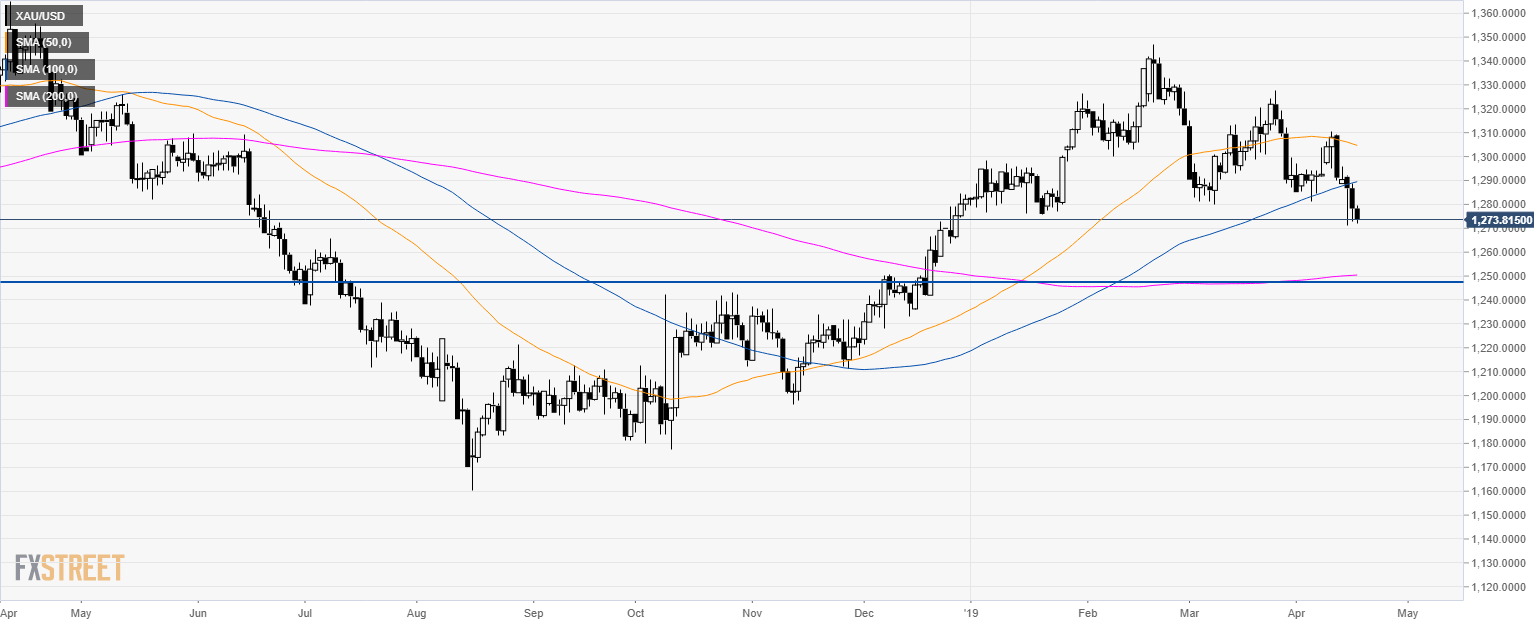
Gold daily chart
- Gold broke below 1,280.00 and the 100 and 200 simple moving averages (SMAs) suggesting a correction down.
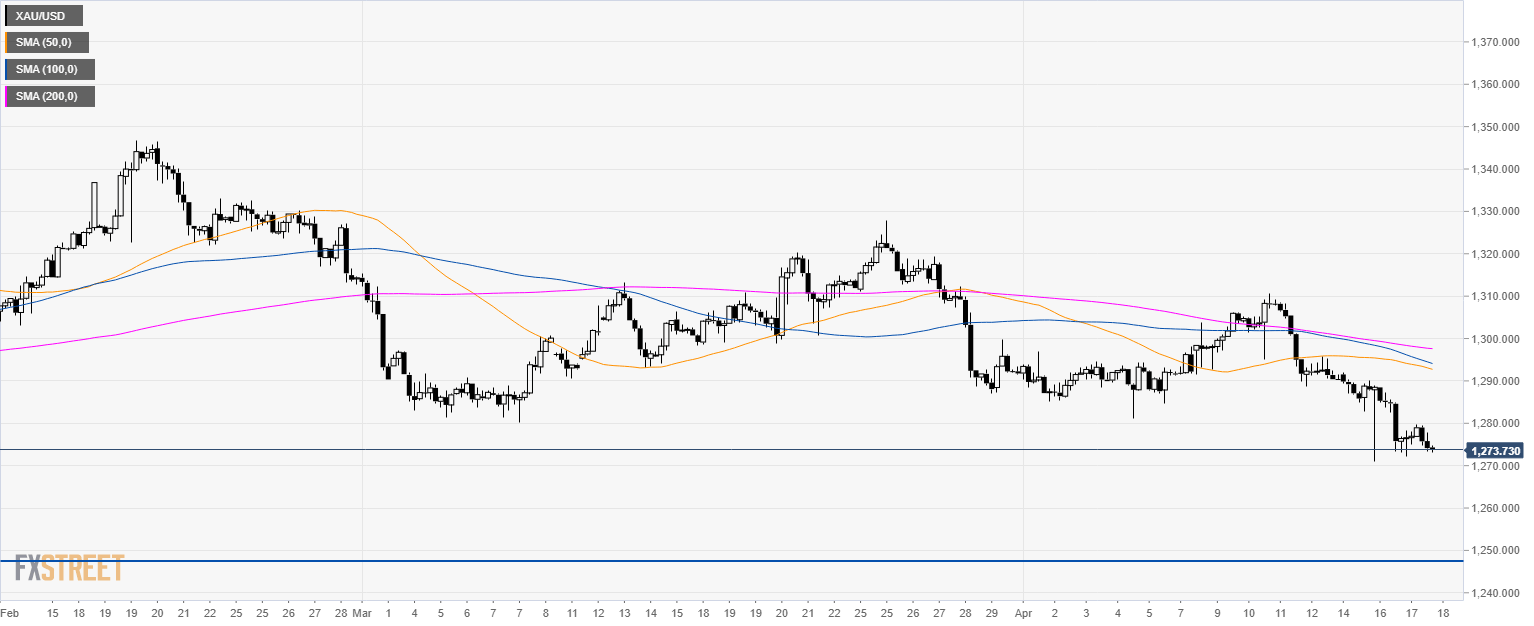
Gold 4-hour chart
- The Yellow Metal is trading below its main SMAs suggesting a bearish bias also in the medium-term.
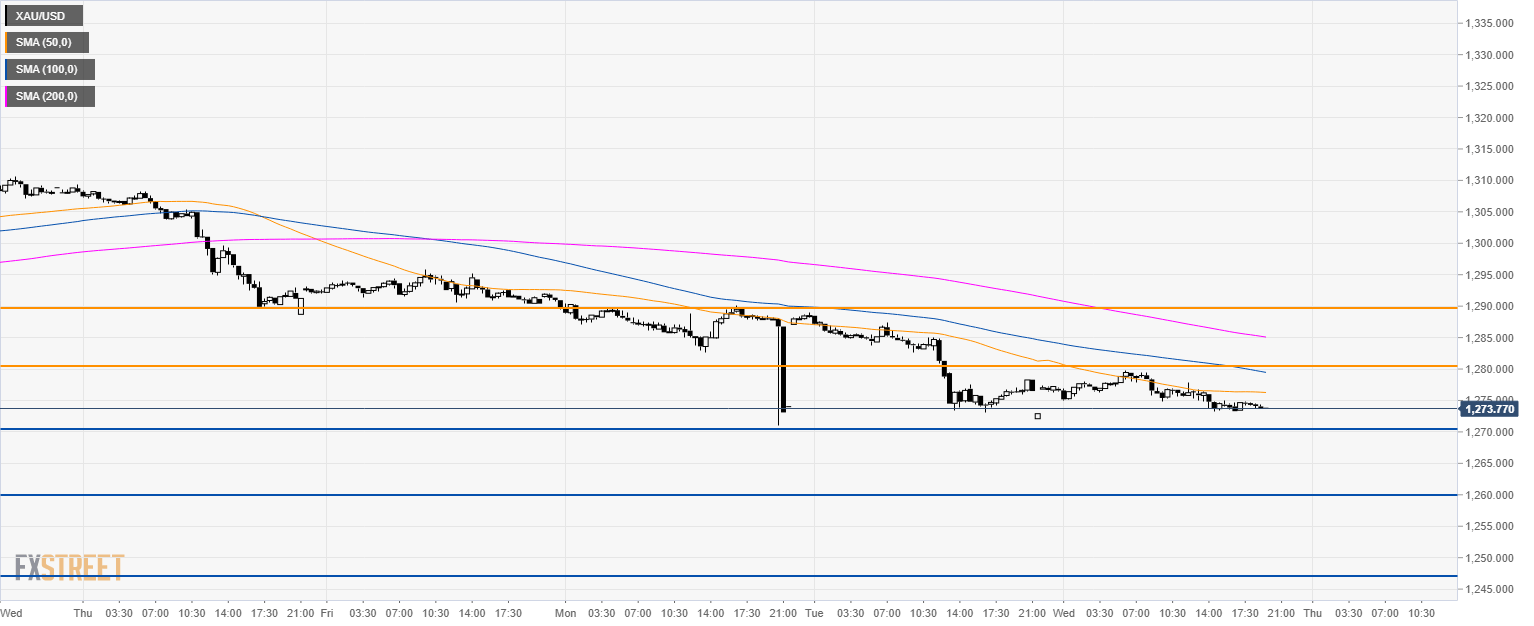
Gold 30-minute chart
- Gold is trading below its main SMAs suggesting bearish momentum in the short-term.
- Bears broke below 1,290.00 support leaving the door open to 1,270.00; 1,260.00 level and 1,247.00 support.
- Resistance is at 1,280.00 and 1,290.00 figure.
Additional key levels
Author

Flavio Tosti
Independent Analyst
More from Flavio Tosti


