Gold dives to new monthly lows following strong US employment data
- Gold falls to multi-week low after US labor market data exceeds expectations.
- China’s People’s Bank halts 18-month Gold buying spree, exerts downward pressure on XAU/USD.
- US Treasury yields surge with the 10-year yield up to 4.43%, bolstering the Greenback and pushing Gold’s price lower.
- Traders eye US inflation data and Fed policy meeting next week.

Gold prices plummeted to a four-week low after the US Bureau of Labor Statistics (BLS) revealed that the labor market remained strong, and China halted its purchase of the golden metal. Therefore, with the XAU/USD trading at $2,295, the non-yielding metal dropped by more than 3%.
The latest US Nonfarm Payrolls report for May revealed the labor market added more people to the workforce, smashing estimates. Despite that, the same report revealed an uptick in the Unemployment Rate, while Average Hourly Earnings witnessed a slight increase.
After the data release, XAU/USD extended its fall, which began during Friday’s Asian session. News that the People’s Bank of China paused its 18-month bullion buying spree weighed on the precious metal.
“Holdings of the precious metal by the PBOC held steady at 72.80 million troy ounces for May,” according to MarketWatch.
So far, Gold has traveled from $2,387 to $2,304 and is about to fall beneath the $2,300 mark. In the meantime, US Treasury bond yields are skyrocketing, with the 10-year bond yield climbing 14 basis points to 4.43%, underpinning the Greenback.
The DXY, an index of the US Dollar against six other currencies, increased 0.79% to 104.91.
Market participants turn to next week's US inflation data and the Federal Reserve’s (Fed) monetary policy meeting. The US Consumer Price Index (CPI) is expected to remain steady, but a reacceleration could trigger further losses for the golden metal.
Daily digest market movers: Gold price on the defensive after strong US jobs report
- US Bureau of Labor Statistics reported that May's Nonfarm Payrolls increased by 272,000, surpassing the forecast of 185,000 and April’s figure of 165,000.
- The Unemployment Rate jumped from 3.9% to 4%, while Average Hourly Earnings increased by 4.1% YoY, up from the previous 4%.
- A stronger-than-expected US NFP report sparked speculation that the Fed will keep rates higher for longer.
- After the data release, the December 2024 CBOT fed funds rate futures contract expects 27 basis points (bps) of easing, 12 bps less than on Thursday.
- Odds for a Fed rate cut in September were lowered from 55% to 47%.
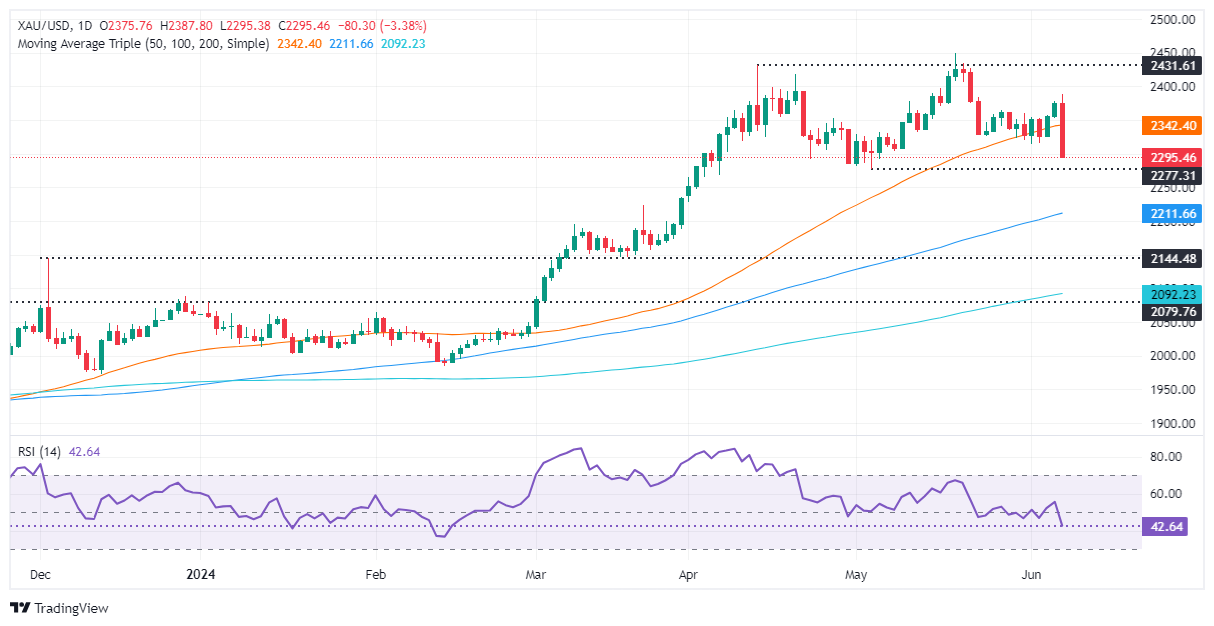
Technical analysis: Gold price collapses below $2,300
Gold prices retreat sharply and appear to form a Head-and-Shoulders chart pattern, which could lower the price of the yellow metal. Momentum has shifted bearish due to the Relative Strength Index (RSI) piercing below the 50-midline, indicating that sellers are in charge.
Therefore, further Gold weakness and sellers could push the spot price below $2,300. Once cleared, the next stop would be the May 3 low of $2,277, followed by the March 21 high of $2,222. Further losses lie beneath, with buyers’ next line of defense at around the $2,200 figure.
Conversely, if Gold buyers lift prices above $2,350, look for a consolidation in the $2,350-$2,380 area.
Gold FAQs
Gold has played a key role in human’s history as it has been widely used as a store of value and medium of exchange. Currently, apart from its shine and usage for jewelry, the precious metal is widely seen as a safe-haven asset, meaning that it is considered a good investment during turbulent times. Gold is also widely seen as a hedge against inflation and against depreciating currencies as it doesn’t rely on any specific issuer or government.
Central banks are the biggest Gold holders. In their aim to support their currencies in turbulent times, central banks tend to diversify their reserves and buy Gold to improve the perceived strength of the economy and the currency. High Gold reserves can be a source of trust for a country’s solvency. Central banks added 1,136 tonnes of Gold worth around $70 billion to their reserves in 2022, according to data from the World Gold Council. This is the highest yearly purchase since records began. Central banks from emerging economies such as China, India and Turkey are quickly increasing their Gold reserves.
Gold has an inverse correlation with the US Dollar and US Treasuries, which are both major reserve and safe-haven assets. When the Dollar depreciates, Gold tends to rise, enabling investors and central banks to diversify their assets in turbulent times. Gold is also inversely correlated with risk assets. A rally in the stock market tends to weaken Gold price, while sell-offs in riskier markets tend to favor the precious metal.
The price can move due to a wide range of factors. Geopolitical instability or fears of a deep recession can quickly make Gold price escalate due to its safe-haven status. As a yield-less asset, Gold tends to rise with lower interest rates, while higher cost of money usually weighs down on the yellow metal. Still, most moves depend on how the US Dollar (USD) behaves as the asset is priced in dollars (XAU/USD). A strong Dollar tends to keep the price of Gold controlled, whereas a weaker Dollar is likely to push Gold prices up.
Author

Christian Borjon Valencia
FXStreet
Markets analyst, news editor, and trading instructor with over 14 years of experience across FX, commodities, US equity indices, and global macro markets.


