Gold price waver following US NFP data, Fed officials comments
- Gold peaked at $2,310 but reversed gains, unable to surpass May 2 high of $2,326.
- US Nonfarm Payrolls missed expectations, leading to lower real yields and diminished safe-haven appeal for Gold.
- Fed officials offer mixed signals with Governor Bowman ready to hike rates.

Gold erased its earlier gains on Friday after the US Bureau of Labor Statistics (BLS) revealed that Nonfarm Payrolls for April missed estimates, depicting a cooling jobs market. On the release, the golden metal edged toward its daily high of $2,310 but failed to crack May 2’s high of $2,326, exacerbating a retracement to current spot prices.
The XAU/USD trades at around $2,300, virtually unchanged, down by 0.02%. Wall Street portrays an optimistic mood weighing on the safe-haven appeal of the non-yielding metal. Of note, US Treasury yields are sliding, with the 10-year benchmark note down seven basis points. US real yields, which correlate inversely with Gold prices, fell six and a half basis points from 2.219% to 2.146%.
A Goldilocks scenario looms for the US following the US NFP report as the Institute for Supply Management (ISM) showed that business activity in the services sector contracted for the first time since December 2022.
Elsewhere, a slew of Federal Reserve (Fed) officials crossed the newswires. Fed Governor Bowman was hawkish in an interview with Bloomberg Television, saying that she’s willing to hike rates if inflation stalls or reverses. Recently, the Chicago Fed's Austan Goolsbee added that the latest US employment report was solid, emphasizing that current monetary policy is restrictive.
Daily digest market movers: Gold dwindles around $2,300 amid falling US yields
- Gold prices remain underpinned by lower US Treasury yields and a softer US Dollar. The US 10-year Treasury note is yielding 4.506%, down seven basis points (bps) from its opening level. The US Dollar Index (DXY), which tracks the Greenback’s performance against six other currencies, edged down 0.29% and is at 105.04.
- April US Nonfarm Payrolls revealed by the Department of Labor, showed the economy added just 175,000 jobs below forecasts of 243,000 and March's upwardly revised 315,000.
- Additional data revealed that the Unemployment Rate increased slightly from 3.8% to 3.9%. Furthermore, Average Hourly Earnings (AHE) grew by only 0.2%, falling short of the expected 0.3%.
- The ISM April Services PMI fell below the critical 50.0 mark, indicating contraction, with a reading of 49.4, which was lower than expected and below the figure for March. A detailed look into the report reveals a slowdown in the Employment subcomponent, alongside a rise in Prices Paid.
- After the data release, Fed rate cut probabilities increased, with traders expecting 38 basis points of rate cuts toward the end of the year.
- The Federal Reserve’s first-rate cut is seen in September, with odds standing at 87% for a 0.25% rate cut. The chances for another quarter of a rate cut in December 2024 stood at 79%. This means the fed funds rate would finish the year at the 4.75%-5.00% range.
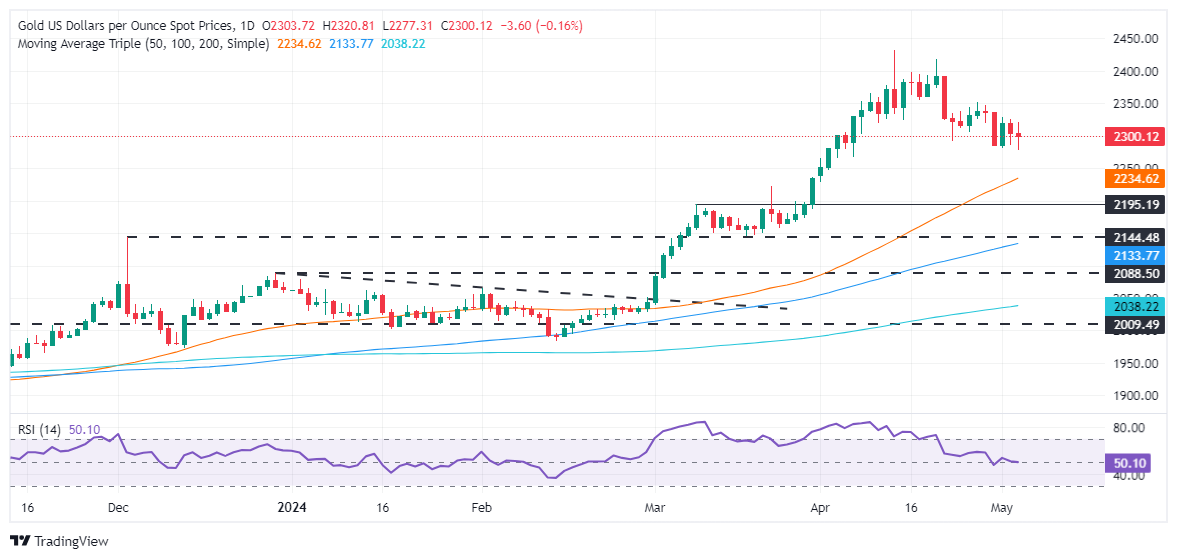
Technical analysis: Gold price drops but stays above $2,300
Gold price remains upwardly biased, though it has remained at around the $2,280 to $2,340 range during the week. It should be said that momentum is still favoring a resumption of the uptrend with the Relative Strength Index (RSI) standing above the 50 midline. Nevertheless, downside risks remain if XAU/USD tumbles below $2,300.
If buyers keep the yellow metal above $2,300, the first resistance would be $2,330. Once cleared, the next stop would be the April 26 high of $2,352, which could open the door to challenging $2,400. Further upside is seen at the April 19 high at $2,417 and the all-time high of $2,431.
Conversely, a bearish continuation looms if Gold sellers drive prices below $2,300, exacerbating a pullback toward the April 23 daily low of $2,291. Subsequent losses are expected beneath the March 21 daily high, which turned into support at $2,223, followed by $2,200.
Gold FAQs
Gold has played a key role in human’s history as it has been widely used as a store of value and medium of exchange. Currently, apart from its shine and usage for jewelry, the precious metal is widely seen as a safe-haven asset, meaning that it is considered a good investment during turbulent times. Gold is also widely seen as a hedge against inflation and against depreciating currencies as it doesn’t rely on any specific issuer or government.
Central banks are the biggest Gold holders. In their aim to support their currencies in turbulent times, central banks tend to diversify their reserves and buy Gold to improve the perceived strength of the economy and the currency. High Gold reserves can be a source of trust for a country’s solvency. Central banks added 1,136 tonnes of Gold worth around $70 billion to their reserves in 2022, according to data from the World Gold Council. This is the highest yearly purchase since records began. Central banks from emerging economies such as China, India and Turkey are quickly increasing their Gold reserves.
Gold has an inverse correlation with the US Dollar and US Treasuries, which are both major reserve and safe-haven assets. When the Dollar depreciates, Gold tends to rise, enabling investors and central banks to diversify their assets in turbulent times. Gold is also inversely correlated with risk assets. A rally in the stock market tends to weaken Gold price, while sell-offs in riskier markets tend to favor the precious metal.
The price can move due to a wide range of factors. Geopolitical instability or fears of a deep recession can quickly make Gold price escalate due to its safe-haven status. As a yield-less asset, Gold tends to rise with lower interest rates, while higher cost of money usually weighs down on the yellow metal. Still, most moves depend on how the US Dollar (USD) behaves as the asset is priced in dollars (XAU/USD). A strong Dollar tends to keep the price of Gold controlled, whereas a weaker Dollar is likely to push Gold prices up.
Author

Christian Borjon Valencia
FXStreet
Markets analyst, news editor, and trading instructor with over 14 years of experience across FX, commodities, US equity indices, and global macro markets.


