Gold Price Forecast: XAU/USD rebounds amid pre-Fed risks, levels to watch – Confluence Detector
- Gold price comes up for fresh air ahead of the all-important Fed decision.
- The US dollar and Treasury yields soften amid investors’ repositioning.
- Battles lines are well defined for XAU/USD, with Powell’s powerplay in focus.

The Fed is widely expected to hike the key rates by 75 bps in the July meeting, the second consecutive super-sized lift-off. Fed Chair Jerome Powell remains committed to taming inflation, despite growing recession risks. But the US dollar and the Treasury yields fail to capitalize on the potentially hawkish narrative, as investors resort to repositioning ahead of the main event risk of this week. This has provided the much-needed reprieve to gold price, allowing the metal to stage a decent comeback so far this Wednesday. Although bulls remain unnerved amid wider caution, as US tech earnings and the European gas crisis will be also closely followed.
Also read: Gold Price Forecast: Bearish momentum building up on Fed day?
Gold Price: Key levels to watch
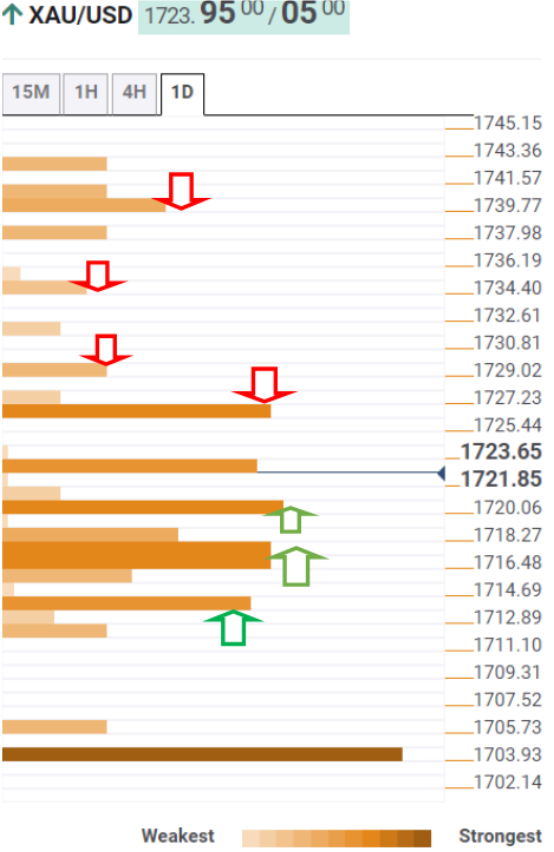
The Technical Confluence Detector shows that the gold price appears to gather pace to take out the $1,727 supply zone.
That level is the convergence of the Fibonacci 23.6% one-week and pivot point one-day R1.
The previous day’s high at $1,729 will come to the immediate rescue of sellers. A firm break above the latter will call for a test of the pivot point one-day R2 at $1,734.
Further upside will threaten a dense cluster of resistance levels stacked up around $1,740, where the previous week’s high, pivot point one-day R3 and the Fibonacci 161.8% one-day merge.
Alternatively, Fibonacci 38.2% one-day $1,720 is the next significant cushion for XAU buyers, below which the $1,717 demand area could be challenged.
At that point, the Fibonacci 38.2% one-week, 23.6% one-day and SMA5 one-day coincide.
The previous day’s low and the SMA50 four-hour intersect at $1,714, which will be a tough nut to crack for bears.
Here is how it looks on the tool
About Technical Confluences Detector
The TCD (Technical Confluences Detector) is a tool to locate and point out those price levels where there is a congestion of indicators, moving averages, Fibonacci levels, Pivot Points, etc. If you are a short-term trader, you will find entry points for counter-trend strategies and hunt a few points at a time. If you are a medium-to-long-term trader, this tool will allow you to know in advance the price levels where a medium-to-long-term trend may stop and rest, where to unwind positions, or where to increase your position size.
Author

Dhwani Mehta
FXStreet
Residing in Mumbai (India), Dhwani is a Senior Analyst and Manager of the Asian session at FXStreet. She has over 10 years of experience in analyzing and covering the global financial markets, with specialization in Forex and commodities markets.

















