Gold Price Forecast: XAUUSD key levels to watch, with Fed ahead – Confluence Detector
- Gold price awaiting a fresh impetus for the next directional push.
- US dollar picks up fresh bids on the return of risk-off flows, recession fears.
- XAUUSD sees healthy barriers on both sides, as focus shifts to Fed decision.

Gold price is reversing its recovery from 16-month lows of $1,681, as the US dollar finds renewed safe-haven demand amid the return of risk-off flows. Recession fears are back in play, in the face of a more hawkish ECB rate hike and weak US jobless claims and Philly Fed Manufacturing Index. The ongoing weakness in the US Treasury yields could cushion the retreat in the yellow metal but the next path for XAUUSD remains at the mercy of the incoming euro area and US data. Investors also turn cautious heading into the weekly closing, with all eyes now turning towards next Wednesday’s 75 bps Fed rate hike announcement. Hawkish Fed expectations and looming recession risks could likely keep any upside in the commodity limited.
Also read: Gold Price Forecast: Will XAUUSD sustain the recovery above $1,700?
Gold Price: Key levels to watch
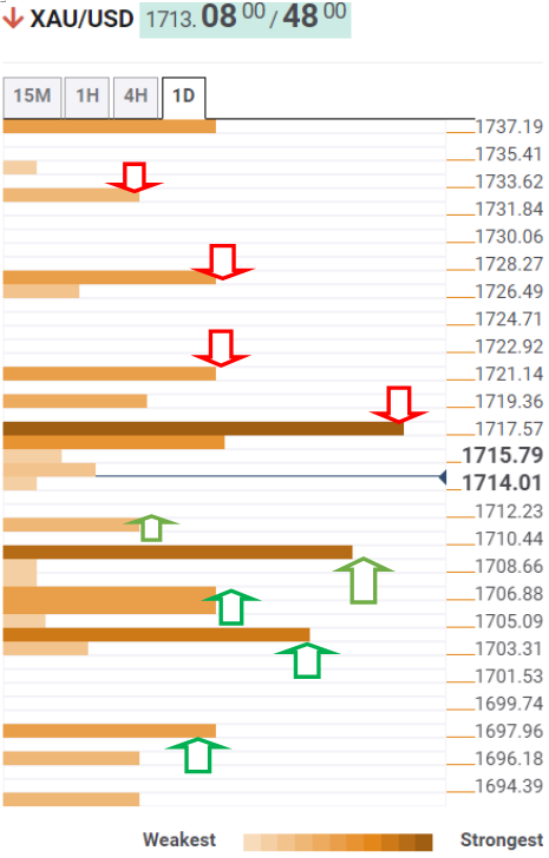
The Technical Confluence Detector shows that the Gold price is struggling to extend its recovery above the powerful hurdle around $1,718, which is the convergence of the Fibonacci 38.2% one-week, SMA10 one-hour and the previous high four-hour.
Acceptance above the latter will call for a retest of the previous day’s high of $1,720. A firm break above it will kick in a fresh advance towards the Fibonacci 61.8% one-week at $1,727.
The pivot point one-day R1 at $1,732 will be the level to beat for gold bulls.
Alternatively, strong support awaits at the Fibonacci 23.6% one-day at $1,711, below which the confluence of the Fibonacci 23.6% one-wee and SMA5 one-day at $1,709 will be put under threat.
The $1,706 support area will be next on sellers’ target, where the Fibonacci 38.2% one-day and SMA5 four-hour merge.
Further south, it's critical for bears to take out the pivot point one-month S3 at $1,704 to fight back complete control. The previous week’s low at $1,698 could be challenged on the additional declines.
Here is how it looks on the tool
About Technical Confluences Detector
The TCD (Technical Confluences Detector) is a tool to locate and point out those price levels where there is a congestion of indicators, moving averages, Fibonacci levels, Pivot Points, etc. If you are a short-term trader, you will find entry points for counter-trend strategies and hunt a few points at a time. If you are a medium-to-long-term trader, this tool will allow you to know in advance the price levels where a medium-to-long-term trend may stop and rest, where to unwind positions, or where to increase your position size.
Author

Dhwani Mehta
FXStreet
Residing in Mumbai (India), Dhwani is a Senior Analyst and Manager of the Asian session at FXStreet. She has over 10 years of experience in analyzing and covering the global financial markets, with specialization in Forex and commodities markets.

















