|

Gold Price Forecast: XAUUSD finds an unexpected support

  • Wall Street futures trimmed Tuesday’s gains as optimism faded.
  • The better performance of the US dollar undermines gold demand.
  • Gold Price keeps hovering around a Fibonacci level at $1,925.00.

Gold Price picks up as US trades reach their desks, approaching a daily high of $1,936.04 a troy ounce. European indexes accelerated their decline, weighing on Wall Street, which has already trimmed most of its Tuesday’s gains.

 Meanwhile, US government bonds paused their slides at the beginning of the day, pushing yields temporarily lower and limiting XAUUSD upside. Nevertheless, the yield on the US 10-year Treasury yield hit a fresh multi-year high of 2.417%, now down to 2.35%.

In the absence of relevant macroeconomic figures, financial markets rotate around the Russia-Ukraine crisis. Crude oil prices are once again on the run, following some comments coming from Moscow. President Vladimir Putin said that they intent to use Russian rouble when selling gas to “non-friendly” countries, clarifying that they will respect their contracts on supply. The barrel of WTI is currently changing hands at $113.65, its highest in two weeks. Higher oil prices provide unexpected support to Gold Price. 

Also read: Gold attempts to rebound after testing key support

XAUUSD Technical Outlook

XAUUSD has spent the week hovering around a Fibonacci level, the 50% retracement of this year’s rally at $1,925.20. Movements away from the level have been shallow, although Gold Price bottomed the previous week near the next Fibonacci support level at $1,980.00, while intraday advances fell short of nearing the 38.2% retracement at $1,960.00. Market participants are looking for a clear break of any of those extremes for more sustained directional strength.

Technical readings in the daily chart suggest that Gold Price may come under further pressure, as it has been unable to move beyond a flat 20 DMA for over a week, meeting sellers around it. The same chart shows that technical indicators are directionless around their midlines, reflecting side-lined speculative interest.

From a fundamental perspective, however, XAUUSD has room to appreciate further and retest bears’ determination at around the $2,000 figure, while a break above the latter could result in a test of record highs in the $2,070 price zone.
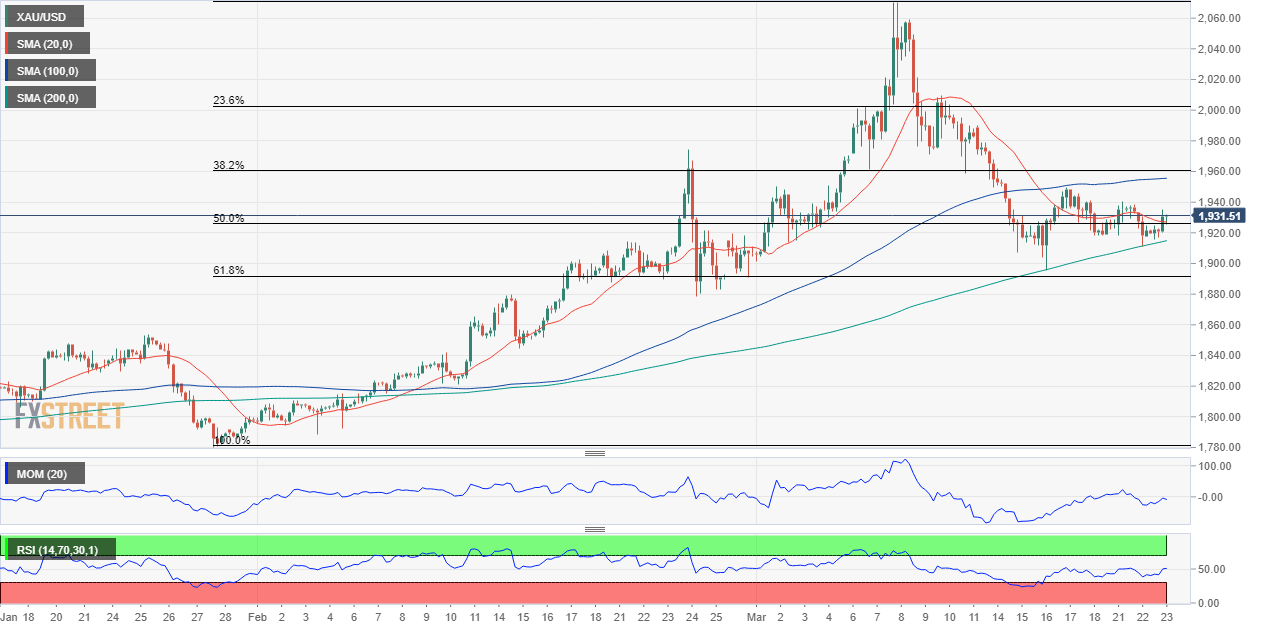
Gold Price 4-hour chart

XAU/USD

Overview
Today last price1929.04
Today Daily Change7.46
Today Daily Change %0.39
Today daily open1921.58
 
Trends
Daily SMA201946.08
Daily SMA501880.27
Daily SMA1001843.1
Daily SMA2001814.49
 
Levels
Previous Daily High1938.52
Previous Daily Low1910.83
Previous Weekly High1990.22
Previous Weekly Low1895.15
Previous Monthly High1974.51
Previous Monthly Low1788.67
Daily Fibonacci 38.2%1921.41
Daily Fibonacci 61.8%1927.94
Daily Pivot Point S11908.77
Daily Pivot Point S21895.95
Daily Pivot Point S31881.08
Daily Pivot Point R11936.46
Daily Pivot Point R21951.33
Daily Pivot Point R31964.15

Author

FXStreet Team

Composed of a group of economic journalists and FX experts, the FXStreet content team produces and oversees all content published on FXStreet. It provides a purely journalistic approach to the Forex market.


More from FXStreet Team
Share:

Editor's Picks

GBP/USD slips toward 1.3350 after soft UK CPI data

GBP/USD erases recovery gains and slips toward 1.3350 in the European session on Wednesday. The UK annual Consumer Price Index (CPI) inflation cooled to 2.6% in June against the market forecast of 2.7%, tempering the British Pound's rebound from weekly troughs. Traders also assess the ongoing Mideast tensions amid a pause in the US Dollar uptrend.

EUR/USD holds above 1.1400 amid US Dollar retreat

EUR/USD holds positive ground above 1.1400 in European trading on Wednesday, helped by hawkish ECB expectations and a broad US Dollar retreat. However, persisting Middle East tensions and surging Oil prices keep the pair's upside elusive.

Gold holds gains above $4,100 undaunted by risk-off markets

Gold extends gains for the fourth consecutive day, standing comfortably above $4,100, unfazed by the risk-off market amid rising tensions in Iran and higher Oil prices. The pair has rallied nearly 2.5% so far this week and is on track for its best weekly performance in more than three months.

Cardano: Short-term recovery lacks retail support

Cardano price edges lower after the 50-day Exponential Moving Average at $1.770 capped two consecutive days of recovery seen earlier this week. ADA futures point to waning retail traction as Open Interest and trading volume decline amid elevated long liquidations. The technical outlook for ADA is bearish, as momentum remains subdued below a resistance trendline near $0.1782.

Chip stocks are more volatile than Oil

I continue to start the day by looking at these two charts: US crude & Kospi. The former is extending gains, trading above $86 per barrel for WTI and $92 per barrel for Brent, while the Kospi is up more than 4.5%, led higher by Korean chipmakers following a similar jump in VanEck's Semiconductor ETF yesterday.

US Dollar mid-year outlook: Exceptional currency, exceptional risks?
The US Dollar enters the second half of 2026 in a markedly different position from a year ago. The King currency has recovered, reflecting persistent US inflation, changing expectations for Fed policy, geopolitical tensions and renewed demand for defensive assets.