Gold Price Forecast: XAU/USD trades with modest gains, remains capped below 200/100-DMA
- Gold gained positive traction for the second successive day on Monday.
- Hawkish Fed expectations and renewed USD strength capped the upside.
- Investors also seemed reluctant ahead of the key central bank meeting.

Gold built on Friday's goodish rebound from the $1,770 area and gained some follow-through traction on the first day of a new week. The headline US CPI accelerated to the highest level since 1982 and acted as a tailwind for the precious metal, which is a proven long-term hedge against rising prices. However, a combination of factors kept a lid on any further gains for the XAU/USD.
The markets seem convinced that the Fed would tighten its monetary policy at a faster pace to contain stubbornly high inflation. This, in turn, continued underpinning the US dollar and capped the upside for the dollar-denominated commodity. Apart from this, the prevalent risk-on environment further held back traders from placing aggressive bullish bets around the safe-haven gold. Investors also seemed reluctant to place aggressive bets, rather preferred to wait on the sidelines ahead of this week's key central bank event risks.
The Fed is scheduled to announce its policy decision on Wednesday and is widely expected to quicken the pace of tapering the bond purchases, setting the stage for an earlier-than-expected interest rate hike. The European Central Bank (ECB), the Bank of England, and the Bank of Japan will also hand down their policy decisions later during the week. The outcome will play a key role in determining the next leg of a directional move for gold prices.
Nevertheless, gold, so far, has managed to hold in the positive territory for the second successive day and remains at the mercy of the broader market risk sentiment/the USD price dynamics. That said, it will still be prudent to wait for a strong follow-through buying before positioning for any further appreciating move amid absent relevant market-moving economic releases.
Technical outlook
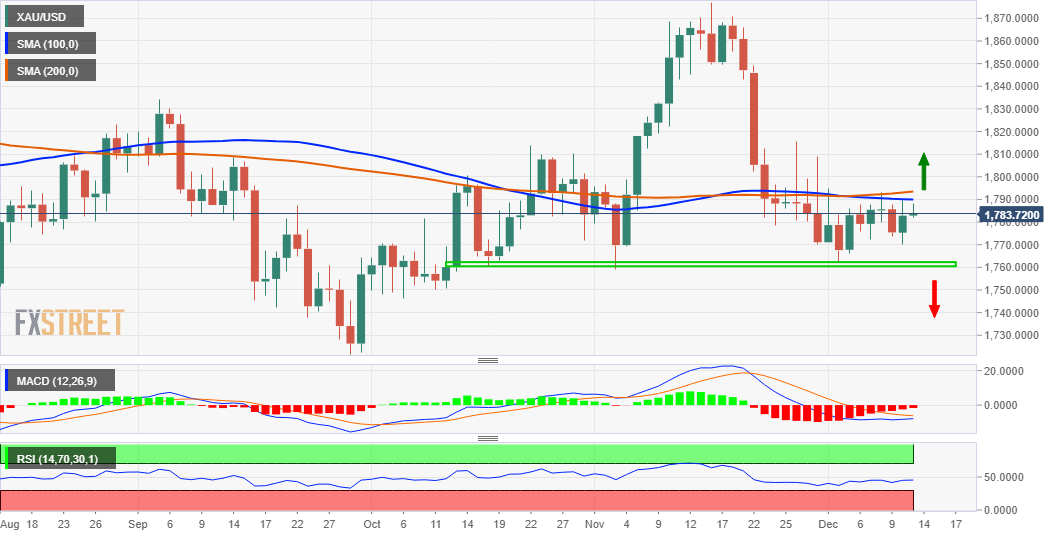
Even from a technical perspective, bulls are likely to wait for a sustained move beyond a technically significant 200-day SMA before placing fresh bets. The mentioned barrier, around the $1,793-95 region, coincides with 100-day SMA and should act as a pivotal point for traders. A convincing breakthrough has the potential to push spot prices beyond the $1,800 mark, towards testing the next relevant resistance near the $1,810-15 supply zone. The momentum could further get extended towards the $1,832-34 strong horizontal barrier.
On the flip side, the $1,775-74 area, followed by the $1,770 level should protect the immediate downside. This is followed by the monthly swing low, around the $1,762 region, which if broken will be set the stage for a fall towards the $1,750-48 support zone. Bearish traders could eventually aim to challenge the $1,725 support zone before dragging the XAU/USD to the $1,700 round figure.
Gold daily chart
Key levels to watch
Author

Haresh Menghani
FXStreet
Haresh Menghani is a detail-oriented professional with 10+ years of extensive experience in analysing the global financial markets.


