|

Gold Price Forecast: XAU/USD stumbles to 5-week lows at around $1850 amid falling US bond yields

  • Gold dives to five-week lows at around $1850 as bears eye the 100-DMA beneath $1820.
  • Market participants are eyeing Tuesday’s US CPI data, which could reaffirm the disinflation process has already started.
  • XAU/USD Price Analysis: A daily close below $1850 would pave the way toward $1820.

Gold price retreated from last Friday’s highs of $1872.22 and dropped toward the $1850 area on Monday despite the US Dollar (USD) fall, ahead of a vital inflation report from the United States (US). Additionally, US Treasury yields, albeit edging down, remain at around five-week highs. At the time of writing, the XAU/USD is trading at $1852.88.

Gold retraces to $1850 weighed by a risk-on mood

XAU/USD remains pressured, while the US Dollar Index, a measure of the buck’s value vs. a basket of peers, drops 0.18%, down at 103.391, undermined by the US 10-year Treasury bond yield, with the 10-year benchmark not dropping one and a half bps to 3.726%.

Investors are awaiting a report from the Bureau of Labor Statistics (BLS) on  Tuesday, revealing the Consumer Price Index (CPI) for January, estimated at 6.2% YoY, lower than the 6.5% in December. The core CPI excludes volatile items like food and energy, which is foreseen at 5.5% YoY, from 5.7% in the previous month.

In the meantime,  Fed hawkish commentary continued with the Fed Governor Michell Bownman, who said that the Federal Reserve (Fed) needs to continue to raise rates to get the Federal Funds Rate(FFR) to a sufficiently restrictive level, as the US central bank battles high inflationary pressures.

Of late, the US Federal Reserve of New York revealed inflation expectations for the year hold steady at 5%. For a three-year horizon, the poll showed that inflation would stand at 2.7%, down from December 2.9%, while for a five-year span, it was projected at 2.5%, vs. 2.4 in the prior month.

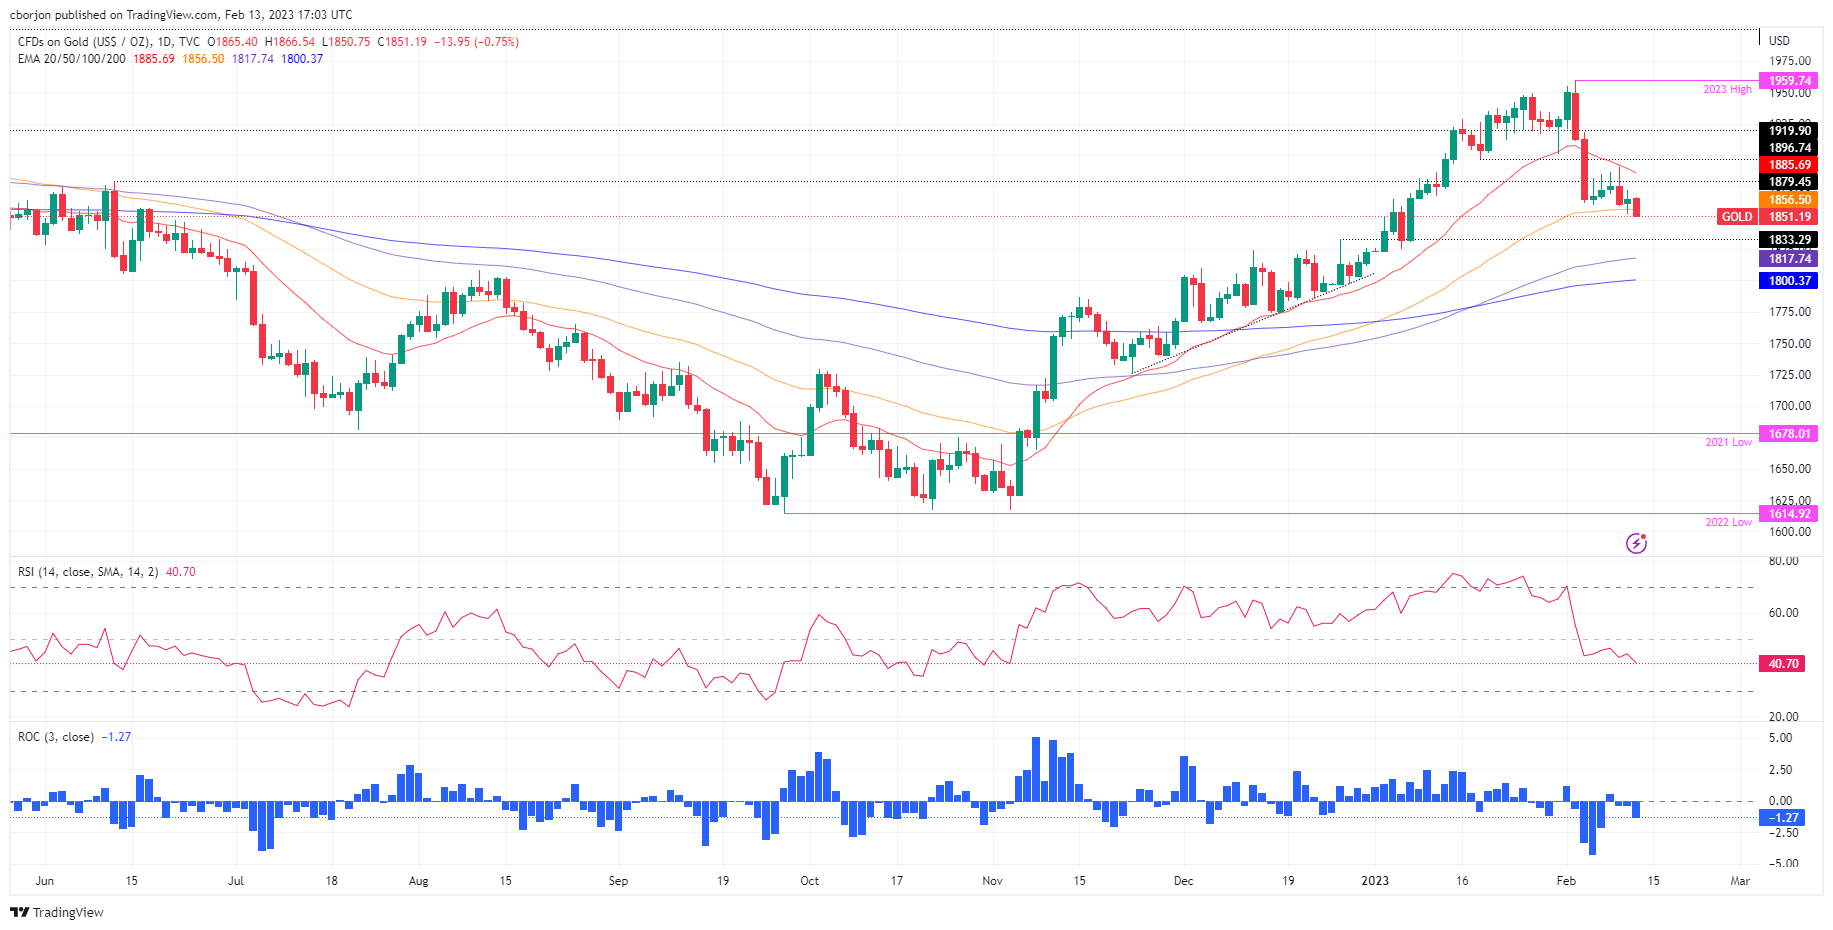
XAU/USD Technical analysis

Technically speaking, XAU/USD remains neutral to slightly downward biased. At the time of typing, the yellow metal falls beneath the 50-day Exponential Moving Average (EMA) At $1856.58, exacerbating further selling pressure. On the downside, the following support levels would be the December 26 daily high of 1833.29 turned support, followed by the 100-day EMA at 1817.77, and the confluence of the 200-day EMA, and the figure at $1800.

XAU/USD

Overview
Today last price1852.67
Today Daily Change-11.66
Today Daily Change %-0.63
Today daily open1864.33
 
Trends
Daily SMA201909.06
Daily SMA501855.63
Daily SMA1001776.55
Daily SMA2001775.81
 
Levels
Previous Daily High1872.33
Previous Daily Low1852.84
Previous Weekly High1890.27
Previous Weekly Low1852.84
Previous Monthly High1949.27
Previous Monthly Low1823.76
Daily Fibonacci 38.2%1864.88
Daily Fibonacci 61.8%1860.29
Daily Pivot Point S11854
Daily Pivot Point S21843.68
Daily Pivot Point S31834.51
Daily Pivot Point R11873.49
Daily Pivot Point R21882.66
Daily Pivot Point R31892.98

Author

Christian Borjon Valencia

Markets analyst, news editor, and trading instructor with over 14 years of experience across FX, commodities, US equity indices, and global macro markets.

More from Christian Borjon Valencia
Share:

Editor's Picks

AUD/USD eyes 0.7150 barrier nine-day EMA

AUD/USD inches higher after registering modest losses in the previous day, trading around 0.7130 during the Asian hours. The technical analysis of the daily chart indicates that the pair is moving sideways within the rectangle pattern, suggesting a consolidation as neither the bulls nor the bears have enough momentum to take control of the market.

USD/JPY trades below 160.00 intervention threshold; bullish bias intact

The USD/JPY pair attracts some sellers during the Asian session amid fears that authorities will step in again to prop up the Japanese Yen. Furthermore, the Israel-Lebanon truce prompts some profit-taking around the US Dollar and exerts downward pressure on the currency pair.

Gold defends 200-day SMA at $4,425, but for how long?

Gold is attempting a tepid recovery toward $4,500 early Thursday, as renewed optimism in the Mideast geopolitical front calms market nerves. This cautious optimism across Asian markets weighs on Oil prices, and diminishes the US Dollar’s safe-haven appeal, helping Gold stage a decent comeback from the weekly low of $4,424.


Hyperliquid: ETF demand, capital rotation fuel HYPE rally as Bitcoin melts

Hyperliquid price sustains an upward trend near its all-time high of $75.76 on Thursday after posting 80% gains in May, while Bitcoin (BTC) retraces below $65,000, triggering a market-wide panic.

Kevin Warsh takes the Fed helm: What it means for the US Dollar
The Federal Reserve moves away from the highly predictable "forward guidance" model of the Jerome Powell era to a new “Kevin Warsh environment”, characterized by less communication, more policy surprises, and an increased focus on the Fed's complex balance sheet.
Recession on paper: What really moves the Canadian Loonie now?

Statistics Canada handed the headline writers a gift and the analysts a headache. Real GDP shrank 0.1% on an annualized basis in the first quarter, and with the fourth quarter of 2025 revised down to a 1.0% contraction, that is two negative quarters in a row, the textbook definition of a technical recession and Canada's first since the pandemic.