Gold Price Forecast: XAU/USD rebound appears elusive below $1,990 hurdle – Confluence Detector
- Gold price struggles to defend Friday’s corrective bounce off seven-week low.
- Haywire US debt ceiling talks flag default fears and weigh on US Dollar, putting a floor under XAU/USD.
- Federal Reserve communications have also been unimpressive and poke Gold bulls.
- US PMIs, Fed’s favorite inflation gauge and debt ceiling negotiations are crucial for XAU/USD directions.

Gold Price (XAU/USD) licks its wounds after a two-week downtrend as markets brace for the top-tier data/events. The precious metal’s latest corrective bounce could be linked to mixed concerns about US debt ceiling expiration as US President Joe Biden appears hopeful of avoiding the default but Republicans appear less in the mood to let go of demands, which in turn stalled previous negotiations. Additionally, the latest shift in Fed Chair Jerome Powell’s tone, citing the banking fears as the catalysts to ease the pressure for higher rates, also allows the XAU/USD to grind higher. Furthermore, upbeat expectations from China add strength to the Gold buyers as they battle the bears.
Alternatively, the recently firmer US data and hawkish Fed bets exert downside pressure on the Gold price, which in turn highlight this week’s US PMIs and Core PCE Price Index, the Fed’s preferred inflation gauge, as the key to determining near-term XAU/USD moves.
Above all, the US debt ceiling announcements are crucial to gauge near-term Gold price moves.
Also read: Gold Price Forecast: Acceptance above $1,990 is critical for XAU/USD on road to recovery
Gold Price: Key levels to watch
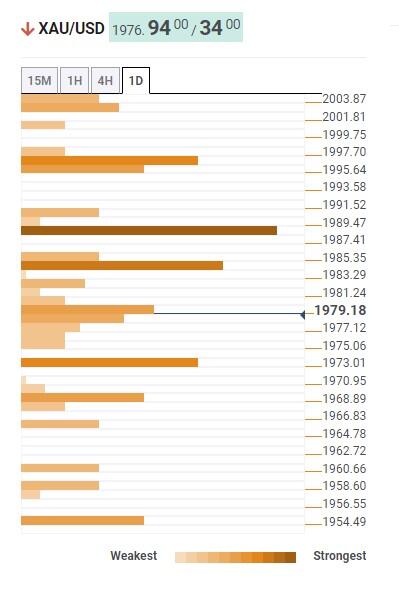
As per our Technical Confluence Indicator, the Gold price stays below the $1,990 resistance confluence comprising the 50-DMA, Fibonacci 68.1% on one month and upper band of the Bollinger on the hourly timeframe.
Before that, the previous daily high and 5-DMA caps immediate upside moves of the Gold price near $1,984.
That said, the upper band of the Bollinger on the four-hour chart and Fibonacci 68.1% on one week highlights $1,995 as an extra filter towards the north ahead of challenging the $2,000 round figure comprising Pivot Point one-day R2.
On the flip side, a convergence of the Fibonacci 38.2% on one day and the middle band of the Bollinger on the hourly chart, around $1,970, restricts short-term Gold price downside.
Following that, the Fibonacci 23.6% on one week, close to $1,968, may prod the XAU/USD bears before directing them toward the $1,954 key support encompassing the lower band of the Bollinger on the four-hour chart and the previous daily low.
It’s worth noting that the Gold price weakness past $1,954 could give control to the bears.
Here is how it looks on the tool
About Technical Confluences Detector
The TCD (Technical Confluences Detector) is a tool to locate and point out those price levels where there is a congestion of indicators, moving averages, Fibonacci levels, Pivot Points, etc. If you are a short-term trader, you will find entry points for counter-trend strategies and hunt a few points at a time. If you are a medium-to-long-term trader, this tool will allow you to know in advance the price levels where a medium-to-long-term trend may stop and rest, where to unwind positions, or where to increase your position size.
Author

Anil Panchal
FXStreet
Anil Panchal has nearly 15 years of experience in tracking financial markets. With a keen interest in macroeconomics, Anil aptly tracks global news/updates and stays well-informed about the global financial moves and their implications.

















