Gold Price Forecast: XAU/USD surrenders modest intraday gains, flirts with $1,800 mark
- Gold price is back on the bids after defending key support around $1798.
- Risk-off mood-driven sell-off in Treasury yields lifts gold price.
- Gold bears await break below 100-day SMA at $1,796

Update: Gold struggled to capitalize on its modest intraday gains, instead met with some fresh supply near the $1,811-12 region and has now dropped to the lower end of its daily trading range. Currently hovering around the $1,800 round-figure mark, the XAU/USD has been oscillating in a range over the past one week or so and was influenced by a combination of factors. Worries about the economic fallout from the fast-spreading Delta variant of the coronavirus weighed on investors' sentiment. This was evident from a generally weaker tone around the equity markets, which acted as a tailwind for the safe-haven gold.
The global flight to safety triggered a fresh leg down in the US Treasury bond yields, which was seen as another factor that extended some support to the non-yielding yellow metal. In fact, the yield on the benchmark 10-year US government bond reversed a major part the last week's move up to the 1.30% threshold. This, in turn, weighed on the US dollar and benefitted dollar-denominated commodities, including gold. Despite the combination of supporting factors, the uptick lacked any follow-through buying or bullish conviction and remained limited in the absence of a fresh fundamental catalyst.
Investors also seemed reluctant to place any aggressive bets, rather preferred to wait on the sidelines ahead of this week's key event risk – the FOMC meeting starting Tuesday. The Fed's latest monetary policy update will play a key role in influencing the greenback in the near term and provide a fresh directional impetus to gold. In the meantime, developments surrounding the coronavirus saga, the broader market risk sentiment, the US bond yields and the USD price dynamics will be looked upon for some short-term opportunities.
Previous update: Gold price is consolidating at higher levels on Monday, kicking off a big week on the right footing. Gold bulls are back in the game after having found solid support around the $1798 region. The downbeat market mood remains the key underlying theme so far, boosted the haven flows into the US Treasuries and gold while weighing on the yields. The benchmark 10-year US Treasury yields are down nearly 5% on the day. Escalating covid concerns and a tense start to the US-Sino trade talks dampen the investors’ sentiment. Additionally, worse than expected German IFO Survey for July intensified economic growth concerns, underpinning gold price.
However, it remains to be seen if gold price can sustain the upside, as markets bet on a hawkish hint from the FOMC meeting this week. The Fed is widely anticipated to signal at a likely taper starting off from the quarter of this year.
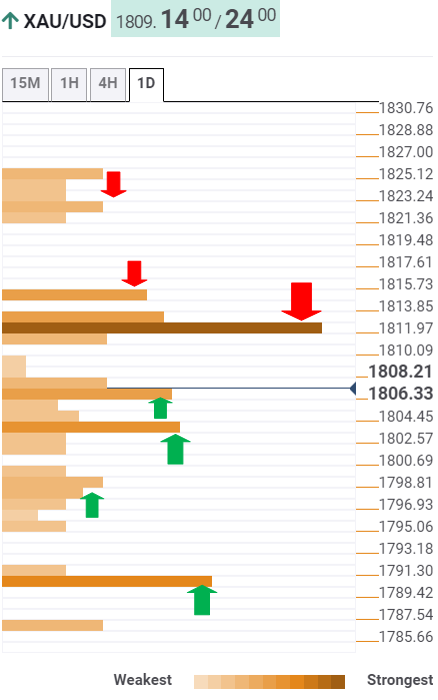
Gold Price: Key levels to watch
The Technical Confluences Detector shows that gold has stalled its recent advance just below the powerful resistance at $1812, which is the convergence of the Fibonacci 61.8% one-week, SMA10 one-day and pivot point one-day R1.
A firm break above that level will challenge the immediate upside barrier at $1814, the Fibonacci 38.2% one-month.
Further up, a dense cluster of healthy resistance levels is seen around $1823, where the SMA200 one-day, the previous week’s high and Fibonacci 161.8% one-day coincide.
On the flip side, gold price will test the $1806 support area, the intersection of the SMA200 four-hour and SMA100 one-hour.
Sellers will then target the confluence of the Fibonacci 38.2% one-week, SMA50 one-hour and Bollinger Band four-hour Middle at $1803.
The next relevant cushion is seen around $1798-$1797, which is the meeting point of the Fibonacci 23.6% one-week, Fibonacci 38.2% one-day and Bollinger Band one-day Middle.
The last line of defense for gold bulls is aligned at $1790, where the Fibonacci 23.6% one-month converges with the previous day’s low.
Here is how it looks on the tool
About Technical Confluences Detector
The TCD (Technical Confluences Detector) is a tool to locate and point out those price levels where there is a congestion of indicators, moving averages, Fibonacci levels, Pivot Points, etc. If you are a short-term trader, you will find entry points for counter-trend strategies and hunt a few points at a time. If you are a medium-to-long-term trader, this tool will allow you to know in advance the price levels where a medium-to-long-term trend may stop and rest, where to unwind positions, or where to increase your position size.
Author

Dhwani Mehta
FXStreet
Residing in Mumbai (India), Dhwani is a Senior Analyst and Manager of the Asian session at FXStreet. She has over 10 years of experience in analyzing and covering the global financial markets, with specialization in Forex and commodities markets.


