Gold Price Forecast: XAU/USD stabilizes near $1,750 on steady USD
- Gold remains on track to close flat on Thursday.
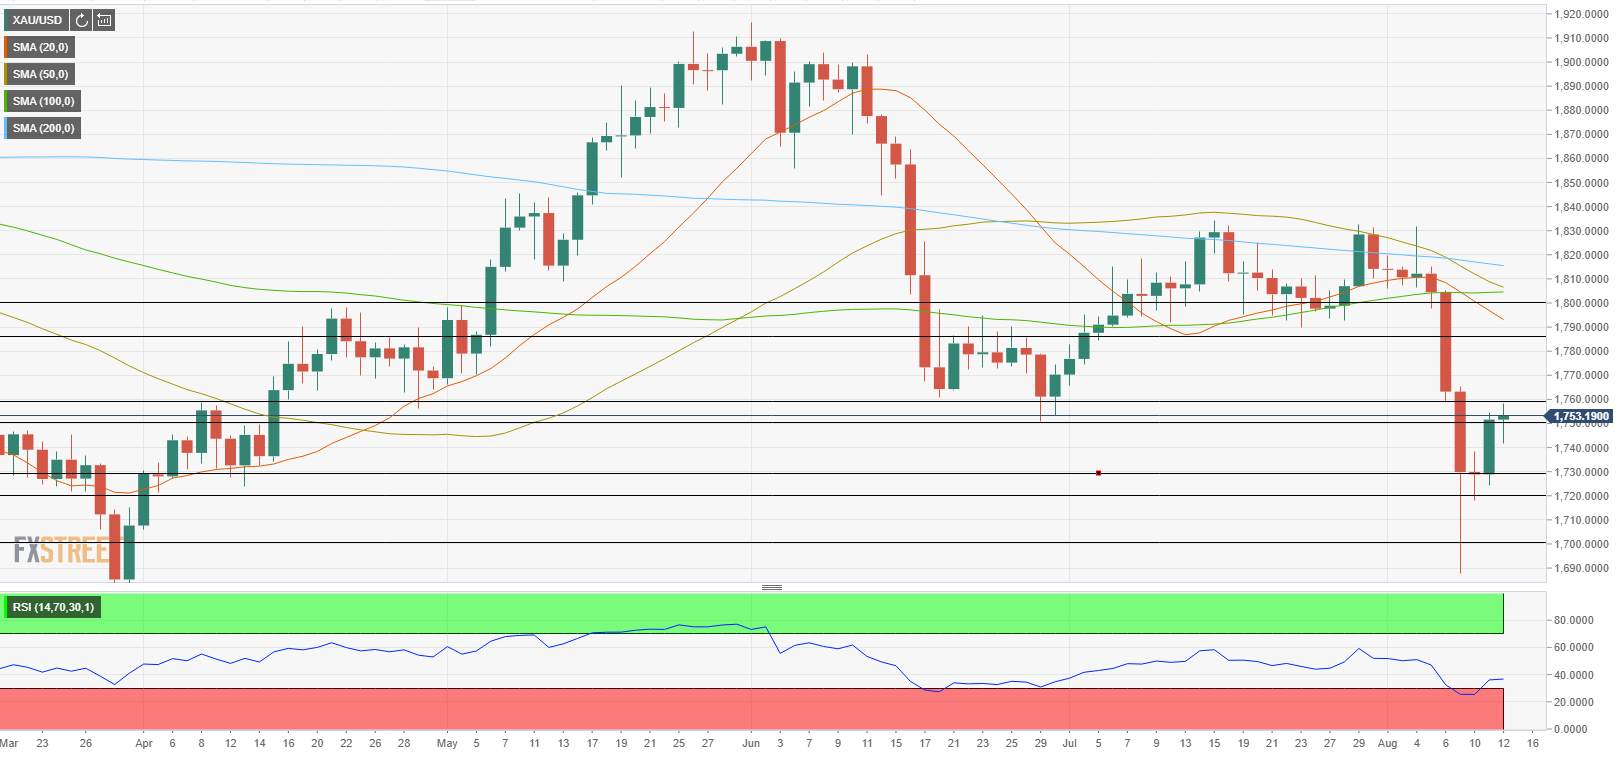
- Key technical levels remain intact as XAU/USD waits for the next significant catalyst.
- Gold could extend its rebound if it manages to clear $1,760.

Update: Gold prices refresh daily high above $1,750 and record some mild gains pushing aside the previous sell-off. The prices seem to be stabilizing now to make a consolidative move in a trading band. The higher USD valuation, which makes the precious metal expansive for the other currencies holders continues to exert pressure on gold’s higher side. The softer US Consumer Price Index (CPI) relives some pressure off the gold prices amid easing concerns that the Fed will not immediately signal a reduction in its bond-purchasing program. The rebound in the US Treasury yields also weighed on the gold prices as it reduces the appeal of the non-yielding asset. A sell-off in equities helped prices to scale up beyond the $1,750 level. Concerns over the delta contagion crisis reduce investor confidence and risk appetite that eventually supported corrective pullback in gold prices.
Following Wednesday's impressive rebound, gold fluctuated in a relatively narrow range on Thursday and remains on track to close the day little changed around $1,750.
The sharp decline witnessed in the US Treasury bond yields and the renewed USD weakness following the July CPI inflation report from the US helped XAU/USD gain traction on Wednesday. Although the pair managed to advance to a daily high of $1,758 earlier in the day, it failed to preserve its bullish momentum.
With the benchmark 10-year US Treasury bond yield rising 2% and erasing Wednesday's losses, the greenback managed to stay resilient against its rivals and forced XAU/USD to retrace its daily climb.
The data from the US showed on Thursday that the Initial Jobless Claims declined by 12,000 to 375,000 in the week ending August 7 as expected. Furthermore, the US Bureau of Labor Statistics reported that the Producer Price Index for final demand rose to 7.8% on a yearly basis in July from 7.3% in June. Although this reading beat the market expectation of 7.3%, it failed to trigger a noticeable market reaction.
On Friday, the University of Michigan's preliminary Consumer Sentiment Index for August will be the only data featured in the US economic docket, suggesting that XAU/USD is likely to stay directionless ahead of the weekend.
Gold technical outlook
The Relative Strength Index (RSI) indicator on the daily chart is moving sideways below 40, showing that the near-term outlook remains bearish after gold corrected its oversold readings.
On the downside, the initial support is located at $1,730 (static level) ahead of $1,720 (August 10 low) and $1,700 (psychological level).
On the other hand, $1,760 aligns as the first static resistance. In case XAU/USD manages to make a daily close above that level and flip it into support, it could target $1,785 (static level) ahead of $1,795 (20-day SMA) and $1,800 (psychological level).
Additional levels to watch for
Author

Eren Sengezer
FXStreet
As an economist at heart, Eren Sengezer specializes in the assessment of the short-term and long-term impacts of macroeconomic data, central bank policies and political developments on financial assets.


