Gold Price Forecast: XAU/USD lacks clear direction around $1,950 amid dicey markets – Confluence Detector
- Gold Price fades the previous day’s corrective bounce off three-month low, sidelined of late.
- Multiple technical levels, mixed sentiment in the market challenge XAU/USD traders.
- More clues to confirm July Fed rate hike eyed to lure the Gold sellers.

Gold Price (XAU/USD) struggles to defend bounce off a three-month low as market players seek more clues to confirm the cautious optimism amid a looming July rate hike. Also challenging the XAU/USD bulls can be the recently mixed US data and the trader’s lack of conviction about the Fed’s July rate hike, even if the policymakers did utter the same on Wednesday.
Elsewhere, fears that China’s economic recovery will slow down, even if the dragon nation’s state planner eyes faster execution of the key projects, exert downside pressure on the Gold Price. Furthermore, the cautious mood ahead of mid-US data and the next week’s Testimony of Fed Chair Jerome Powell challenges the XAU/USD optimists, especially after this week’s central-bank moves.
Also read: Gold Price Forecast: XAU/USD needs weekly close above 21 DMA for a meaningful recovery
Gold Price: Key levels to watch
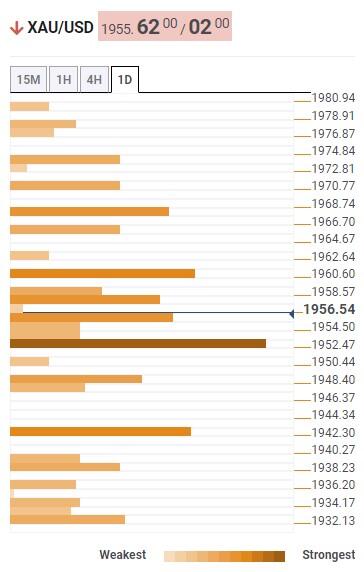
As per our Technical Confluence Indicator, the Gold Price retreats towards the $1,950 key support comprising Fibonacci 61.8% on the weekly play, Fibonacci 23.6% on the daily chart and the 5-DMA.
In a case where the XAU/USD prod the immediate support, like it did Thursday, the bears will jostle with another important downside level, also the last defense of the buyers, around $1,940 that encompasses 100-DMA and the Pivot Point one-week S1.
On the contrary, Fibonacci 38.2% on weekly chart joins previous daily high and the upper band of the Bollinger on the 15-minute chart to restrict immediate Gold Price upside near $1,961-62.
Following that, Fibonacci 38.2% on one-month, around $1,968, will check the XAU/USD bulls before giving them control.
Here is how it looks on the tool
About Technical Confluences Detector
The TCD (Technical Confluences Detector) is a tool to locate and point out those price levels where there is a congestion of indicators, moving averages, Fibonacci levels, Pivot Points, etc. If you are a short-term trader, you will find entry points for counter-trend strategies and hunt a few points at a time. If you are a medium-to-long-term trader, this tool will allow you to know in advance the price levels where a medium-to-long-term trend may stop and rest, where to unwind positions, or where to increase your position size
Author

Anil Panchal
FXStreet
Anil Panchal has nearly 15 years of experience in tracking financial markets. With a keen interest in macroeconomics, Anil aptly tracks global news/updates and stays well-informed about the global financial moves and their implications.

















