|

Gold Price Forecast: XAU/USD juggles around $1,840 amid mixed market mood, US Services PMI in focus

  • Gold price is oscillating near $1,840.00 as the risk profile looks obscure ahead of US Services PMI.
  • More rate hikes from the Fed would dent the confidence of US firms.
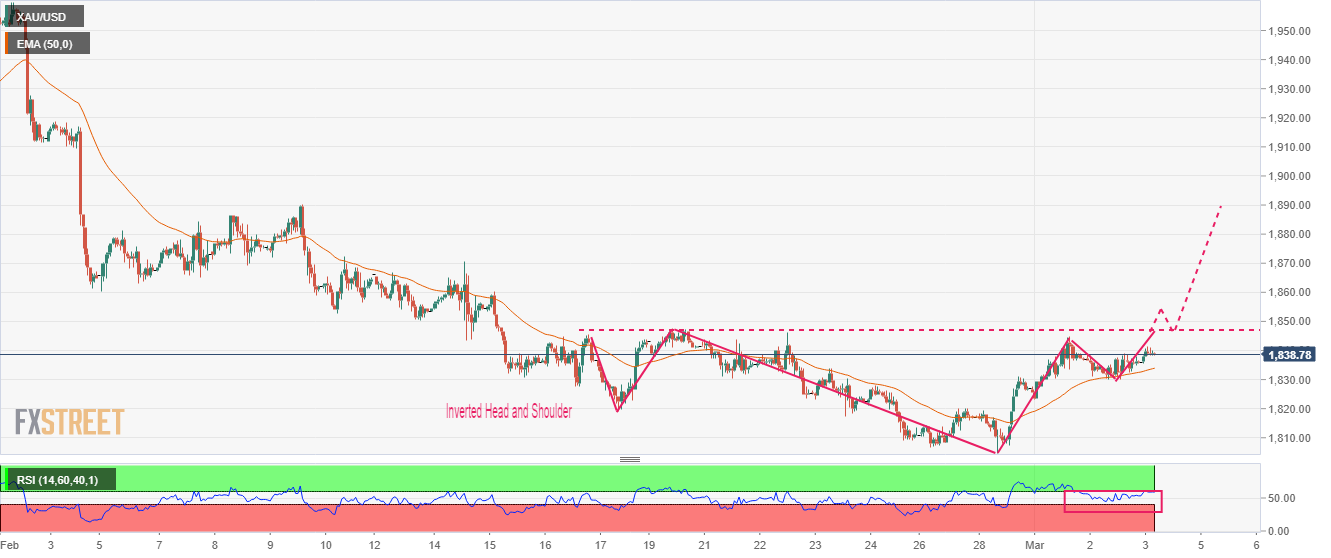
  • Gold price is forming an Inverted H&S pattern that indicates a bullish reversal.

Gold price (XAU/USD) is displaying back-and-forth moves around $1,840.00 in the Asian session after a gradual move from $1,830.00. The precious metal has turned sideways amid mix market mood. The US Dollar Index (DXY) looks vulnerable above 104.80 and is likely to display a downside move further.

Long liquidations in the S&P500 futures have deepened in the Asian session as investors are getting anxious ahead of the release of the United States Services PMI by the Institute of Supply Management (ISM). The 500-US stocks basket futures displayed a sheer recovery on Thursday as geopolitical tensions between the US and China eased.

China’s Vice Commerce Minister said in a statement on Thursday, “China is willing to conduct candid consultations with the US to reduce restrictions on bilateral trade and investment.” He further added, “Need to create a stable and predictable economic and trade environment between China and US to enhance the confidence of business cooperation.”

Meanwhile, fears of more rates from Federal Reserve (Fed) chair Jerome Powell expected in the March monetary policy are not fading as further rate hikes could dent the confidence of producers. Also, the strong labor market could soften if lay-off programs in the technology firms stretch to other sectors.

Gold technical analysis

Gold price is forming an Inverted head and Shoulder chart pattern that indicates a prolonged consolidation and a breakout of the same confirms a bullish reversal. The neckline of the Inverted H&S chart pattern is plotted from February 20 high around $1,848.00. The 50-period Exponential Moving Average (EMA) is acting as a major support for the Gold bulls.

A break into the bullish range of 60.00-80.00 by the Relative Strength Index (RSI) (14) will trigger the upside momentum.

Gold hourly chart
XAU/USD

Overview
Today last price1838.74
Today Daily Change2.56
Today Daily Change %0.14
Today daily open1836.18
 
Trends
Daily SMA201844.18
Daily SMA501867.48
Daily SMA1001798.78
Daily SMA2001775.47
 
Levels
Previous Daily High1839.02
Previous Daily Low1830.01
Previous Weekly High1847.59
Previous Weekly Low1808.99
Previous Monthly High1959.8
Previous Monthly Low1804.76
Daily Fibonacci 38.2%1833.45
Daily Fibonacci 61.8%1835.58
Daily Pivot Point S11831.12
Daily Pivot Point S21826.06
Daily Pivot Point S31822.11
Daily Pivot Point R11840.13
Daily Pivot Point R21844.08
Daily Pivot Point R31849.14

Author

Sagar Dua

Sagar Dua

FXStreet

Sagar Dua is associated with the financial markets from his college days. Along with pursuing post-graduation in Commerce in 2014, he started his markets training with chart analysis.


More from Sagar Dua
Share:

Editor's Picks

GBP/USD bounces off four-day lows, still below 1.3500

GBP/USD sticks to the bearish tone on Thursday, coming down to the 1.3480 region in the latter part of the NA session. In the meantime, Cable’s weakness comes as investors continue to assess mixed UK data, poor US results, and the persistent uncertainty surrounding the US-Iran conflict.

EUR/USD looks apathetic around 1.1530

EUR/USD reverses Wednesday’s downtick and trades with modest gains in the 1.1530 region following the end of the NA session on Thursday. The pair’s tepid advance comes on the back of the absence of clear direction in the US Dollar despite tensions from the Middle East appear far from alleviated. Later on Friday, investors are expected to monitor the the releases of another revision of GDP figures in the Euroland, US Retail Sales and the preliminary U-Mich gauge.

Gold remains on the defensive below $4,350; downside seems cushioned

Gold trades below $4,350 during the Asian session on Friday and looks to extend the previous day's pullback from the highest level since June 5 as the US-Iran standoff continues to underpin the US Dollar's reserve-currency status. However, reduced bets for an immediate Fed rate hike, amid signs of cooling US inflation, should act as a tailwind for the non-yielding bullion and help limit deeper losses.

Dogecoin reclaims $0.07 support as whales step in
Dogecoin (DOGE) edges above the daily open, trading above $0.070 as of Thursday. While this uptick offers a positive signal, DOGE continues to trade within a broader bearish context, down approximately 12% from its July peak of $0.079. Still, should the $0.070 support level hold, the mild recovery could gather pace, targeting resistance at $0.080 and potentially the key $0.100 threshold.
Why credit markets aren’t pricing $570B of AI debt

Forecasts put global artificial intelligence related debt issuance near $570 billion this year, with roughly $236 billion of it priced by the end of May at four times the prior year's pace. Data centre securitisation alone has gone from about $4 billion a year through 2022 to roughly $10 billion in each of 2023 and 2024, and then $27 billion in 2025.

Why is Crude Oil priced for a reopening the ships haven't made?
Fourteen vessels crossed the Strait of Hormuz on Tuesday. Before the war, the count ran near 120 a day. In the sessions since the waterway was publicly declared open, Brent has drifted back to $87 and West Texas Intermediate (WTI) to $81, both a little lower again on Wednesday, with daily momentum on each unwound from the top of its range in late July to the low twenties now.














