Gold Price Forecast: XAU/USD is testing trendline resistance at $3,325
- Gold pared losses on US Dollar weakness to test trendline resistance at $3,325.
- Higher hopes of Fed cuts sent US yields lower, undermining the US Dollar's attractiveness.
- XAU/USD maintains the broader bearish bias in play while below $3,325 and $3,345.

Gold (XAU/USD) found buyers right below the $3,300 level on Wednesday to regain some of the ground lost over the previous days. The retreat in US Yields is supporting the precious metal, but the broader trend remains bearish, while below the trendline resistance, at $3,325.
,
The Minutes of the last Federal Reserve meeting heightened hopes of at least one rate cut in 2025, which snapped a five-day rally on US Treasury yields. The USDollar dropped across the board, and the yieldless Gold bounced up.
Technical analysis: XAU/USD will face resistance at $3,325 and $3,345
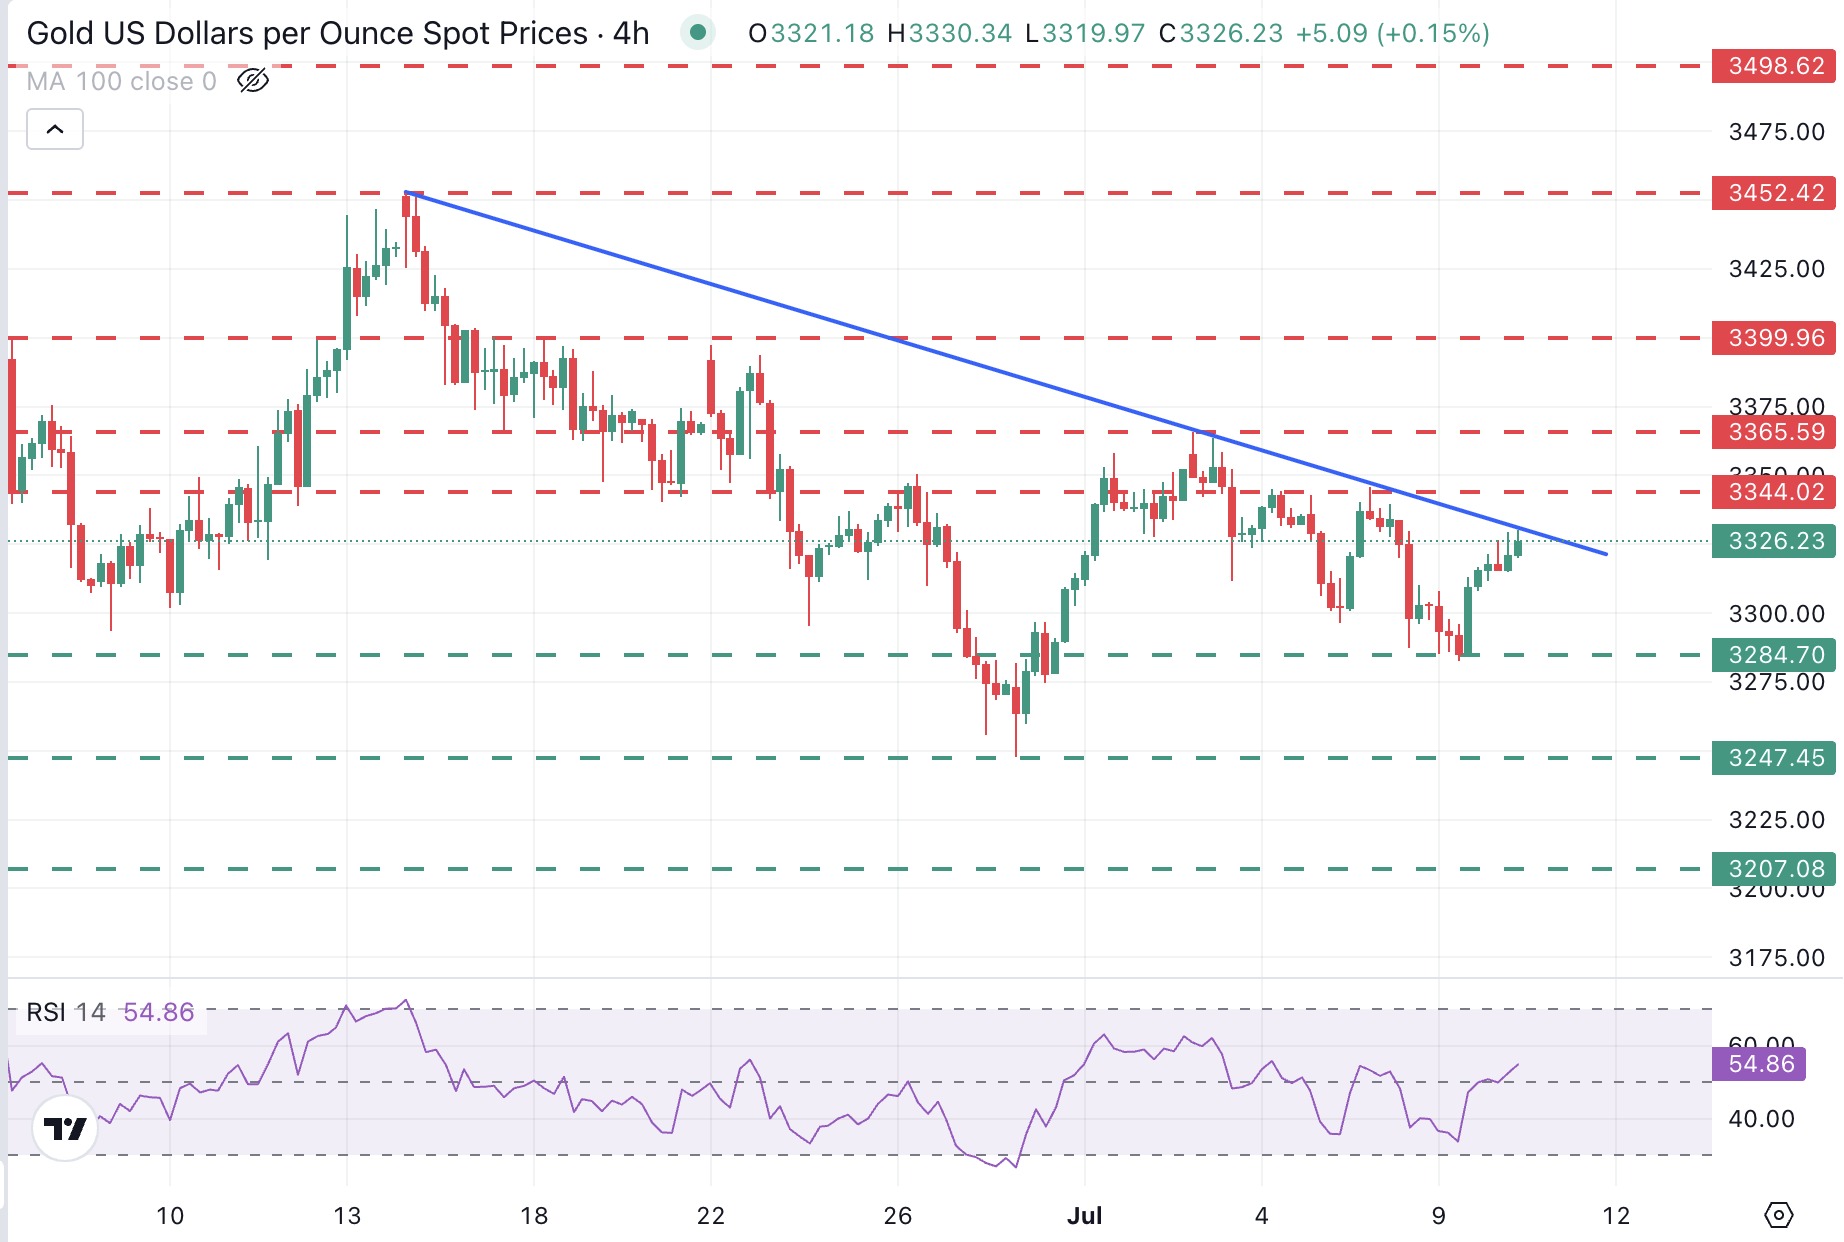
A look at the 4-hour chart and we see price action testing the descending trendline resistance from mid-June highs, at $3,325. The Relative Strength Index (RSI 14) has crossed above the 50 level, showing a mounting bullish momentum, but the pair should breach above this level and the July 4 and 7 highs, at $3,345, to confirm a trend shift.
Above here, the next target would be the $3,400 area, which capped upside attempts on June 17, 18, and 22, and which closes the path to June’s top, at $3,452.
A rejection from the current level, on the contrary, is likely to seek support at the July 9 low, at $3,285, ahead of the May 28 and June 30 lows, at $3,245 and the May 20 low at $3,205.
Gold FAQs
Gold has played a key role in human’s history as it has been widely used as a store of value and medium of exchange. Currently, apart from its shine and usage for jewelry, the precious metal is widely seen as a safe-haven asset, meaning that it is considered a good investment during turbulent times. Gold is also widely seen as a hedge against inflation and against depreciating currencies as it doesn’t rely on any specific issuer or government.
Central banks are the biggest Gold holders. In their aim to support their currencies in turbulent times, central banks tend to diversify their reserves and buy Gold to improve the perceived strength of the economy and the currency. High Gold reserves can be a source of trust for a country’s solvency. Central banks added 1,136 tonnes of Gold worth around $70 billion to their reserves in 2022, according to data from the World Gold Council. This is the highest yearly purchase since records began. Central banks from emerging economies such as China, India and Turkey are quickly increasing their Gold reserves.
Gold has an inverse correlation with the US Dollar and US Treasuries, which are both major reserve and safe-haven assets. When the Dollar depreciates, Gold tends to rise, enabling investors and central banks to diversify their assets in turbulent times. Gold is also inversely correlated with risk assets. A rally in the stock market tends to weaken Gold price, while sell-offs in riskier markets tend to favor the precious metal.
The price can move due to a wide range of factors. Geopolitical instability or fears of a deep recession can quickly make Gold price escalate due to its safe-haven status. As a yield-less asset, Gold tends to rise with lower interest rates, while higher cost of money usually weighs down on the yellow metal. Still, most moves depend on how the US Dollar (USD) behaves as the asset is priced in dollars (XAU/USD). A strong Dollar tends to keep the price of Gold controlled, whereas a weaker Dollar is likely to push Gold prices up.
Author

Guillermo Alcala
FXStreet
Graduated in Communication Sciences at the Universidad del Pais Vasco and Universiteit van Amsterdam, Guillermo has been working as financial news editor and copywriter in diverse Forex-related firms, like FXStreet and Kantox.


