|

Gold Price Forecast: XAU/USD holds auction above $1,950 amid lack of clarity ahead of Fed Powell’s testimony

  • Gold price has stabilized above $1,950.00 amid subdued performance by the USD Index.
  • Investors are going light into the American session as US markets will open after an extended weekend.
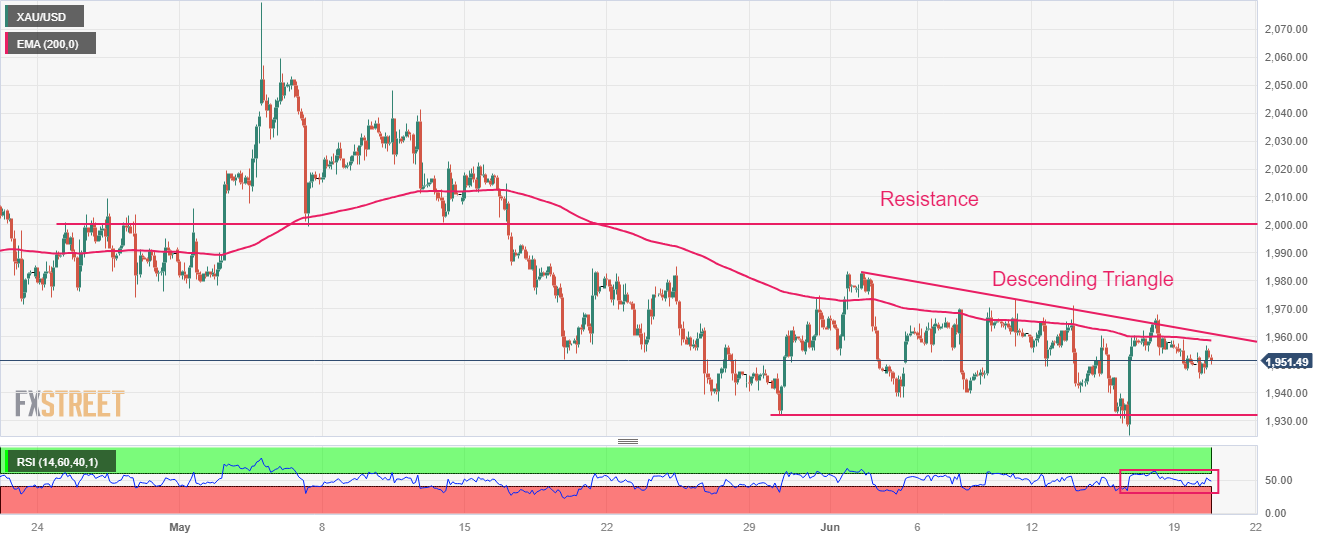
  • Gold price is auctioning in a Descending Triangle chart pattern that indicates a volatility contraction.

Gold price (XAU/USD) is holding itself above the crucial support of $1,950.00 as the US Dollar Index (DXY) is demonstrating a subdued performance in the European session. The precious metal is broadly showing a non-directional performance as investors lack clarity about further action ahead of testimony from Federal Reserve (Fed) chair Jerome Powell’s testimony.

S&P500 futures have trimmed some losses posted in Europe. Investors are going light into the American session as US markets will open after an extended weekend. The US Dollar Index (DXY) is inside the woods around 102.44 as the testimony of Fed Powell will provide clear guidance about interest rates. The US Treasury yields have come under pressure as investors are expecting that only one interest rate hike is left in the basket of the Fed.

In the monetary policy statement, Fed Powell confirmed that the central bank will hike interest rates two times by the year-end. Also, rate cuts are not appropriate as US Employment situation has not softened yet. The US economy is operating at full employment levels and firms are facing higher payouts to retain talent. Apart from the tight labor market conditions, Fed policymakers believe that tight credit conditions by the US regional banks would keep a lid on inflationary pressures.

Gold technical analysis

Gold price is auctioning in a Descending Triangle chart pattern on a two-hour scale that indicates a volatility contraction. Downward-sloping trendline of the aforementioned chart pattern is plotted from June 02 high at $1,983.00 while its horizontal support is placed from May 30 low at $1,932.12.

The 200-period Exponential Moving Average (EMA) at $1,958.84 is acting as a barricade for the Gold bulls. Horizontal resistance is plotted from May 05 low around $2,000.00.

The Relative Strength Index (RSI) (14) is oscillating in the 40.00-60.00 range, which indicates a non-directional performance.

Gold two-hour chart
XAU/USD

Overview
Today last price1951.81
Today Daily Change1.76
Today Daily Change %0.09
Today daily open1950.05
 
Trends
Daily SMA201955.7
Daily SMA501984.5
Daily SMA1001942.31
Daily SMA2001848.8
 
Levels
Previous Daily High1958.85
Previous Daily Low1947.86
Previous Weekly High1971.01
Previous Weekly Low1924.85
Previous Monthly High2079.76
Previous Monthly Low1932.12
Daily Fibonacci 38.2%1952.06
Daily Fibonacci 61.8%1954.65
Daily Pivot Point S11945.66
Daily Pivot Point S21941.26
Daily Pivot Point S31934.67
Daily Pivot Point R11956.65
Daily Pivot Point R21963.24
Daily Pivot Point R31967.64

Author

Sagar Dua

Sagar Dua

FXStreet

Sagar Dua is associated with the financial markets from his college days. Along with pursuing post-graduation in Commerce in 2014, he started his markets training with chart analysis.


More from Sagar Dua
Share:

Editor's Picks

AUD/USD trims losses, still near 0.6900

AUD/USD remains well on the defensive, adding to Wednesday’s pullback and trading close to the key 0.6900 contention zone ahead of the opening bell in Asia. Discouraging prints from the Australian labour market report have weighed on the Aussie, which has remained unable to take advantage from the marked pullback in the Greenback.

USD/JPY slides back below 158.00 as USD reverses post-CPI gains

USD/JPY extends the previous day's pullback from a three-week high, attracting follow-through selling and sliding below 158.00 during Thursday's Asian session. Traders remain on high alert amid speculation that authorities will step in to prop up the Japanese Yen. The US Dollar, meanwhile, reverses Wednesday's hot CPI-led gains to April 2025 highs as US bond yields retreat on China bond-buying talk, further pressuring the pair.

Gold: Upside remains capped by $4,200

Gold regains the smile and leaves behind three consecutive days of losses, advancing to the $4,170 region per troy ounce on Thursday. The precious metal’s recovery comes amid the fresh offered stance in the Greenback and declining US Treasury yields while investors remain cautious ahead of the Fed’s Warsh speech on Friday.

Bitcoin rebounds to $82,000 as PPI hits 6.3%, nearly $1B liquidated
Bitcoin (BTC) recovered near $82,000 on Thursday after briefly falling below $80,000, paring losses triggered by hotter-than-expected US inflation data. September PPI inflation rose 6.3% YoY, exceeding forecasts of 5.3% and marking its second-highest level since November 2022. Core PPI inflation climbed to 5% annually, above expectations of 4.4%.
The Iran war will eventually end. Tariffs won't. Here's the problem
Two cost shocks are in the September Consumer Price Index (CPI), and they have different half-lives. Energy is up 20.4% on the year and accounts for about 1.3 points of the 3.7% headline, and that shock reverses when Oil does: Brent was back at its pre-war price on July 1 and above $100 again by the end of the month, after the ceasefire collapsed on July 8.
Everyone's dumping Gold after hot US inflation. Here's why $4,100 could be a floor, not a cliff
Gold (XAU/USD) is recovering from a sharp sell-off triggered by hotter-than-expected United States (US) inflation data released on Wednesday. The precious metal briefly plunged toward $4,073 as investors increased their bets on further Federal Reserve (Fed) interest rate hikes before recovering as US Treasury yields and the US Dollar (USD) reversed their initial gains.















