Gold Price Forecast: XAU/USD eyes acceptance above $1,792 for further upside – Confluence Detector


The optimism around the less severe effects of the new Omicron covid variant continues to play out so far this week, downing the safe-haven US dollar. In lieu of this, gold price clinched fresh weekly highs, also benefiting from the weakness in the Treasury yields. Investors eagerly await Friday’s US inflation data for fresh trading impulse. Hotter US inflation is likely to seal in the Fed’s faster tapering, which could impede gold’s renewed upside.

Read: Gold Price Forecast: XAU/USD at a critical juncture, awaits US inflation for next big move

Gold Price: Key levels to watch

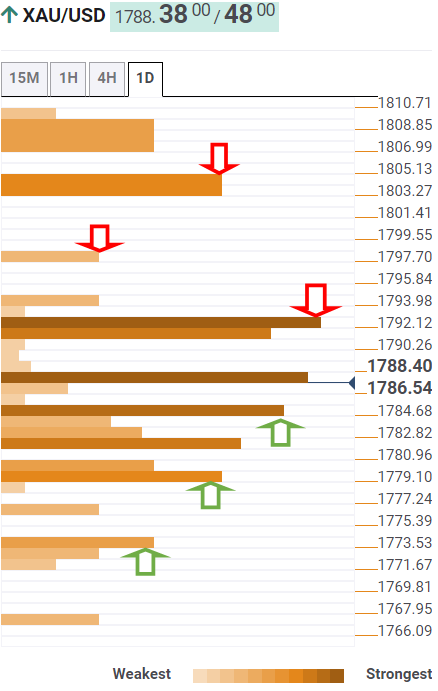
The Technical Confluences Detector shows that the gold price is facing strong offers at $1,792, the powerful supply zone comprising of the SMAs100 and 200 one-day and the Fibonacci 61.8% one-week.

A firm break above the latter is awaited to extend the recovery momentum towards the $1800 level – the pivot point one-day R2.

The next critical upside hurdle is seen around $1,805, where the Fibonacci 38.2% one-month aligns.

On the flip side, immediate support is envisioned at the Fibonacci 23.6% one-day of $1,785.

If the selling pressure intensifies, then sellers would target the intersection of the Fibonacci 38.2% one-day and SMA10 one-day at $1,782.

Gold bears will need to crack the fierce support at $1,779, the confluence of the Fibonacci 61.8% one-day and SMA5 one-day, to open up the further downside.

Further south, $1,772 will be the level to beat for gold sellers. That level is the convergence of the previous day’s low and the Fibonacci 23.6% one-week.

Here is how it looks on the tool

fxsoriginal

About Technical Confluences Detector

The TCD (Technical Confluences Detector) is a tool to locate and point out those price levels where there is a congestion of indicators, moving averages, Fibonacci levels, Pivot Points, etc.  If you are a short-term trader, you will find entry points for counter-trend strategies and hunt a few points at a time. If you are a medium-to-long-term trader, this tool will allow you to know in advance the price levels where a medium-to-long-term trend may stop and rest, where to unwind positions, or where to increase your position size.

Share: Feed news

Information on these pages contains forward-looking statements that involve risks and uncertainties. Markets and instruments profiled on this page are for informational purposes only and should not in any way come across as a recommendation to buy or sell in these assets. You should do your own thorough research before making any investment decisions. FXStreet does not in any way guarantee that this information is free from mistakes, errors, or material misstatements. It also does not guarantee that this information is of a timely nature. Investing in Open Markets involves a great deal of risk, including the loss of all or a portion of your investment, as well as emotional distress. All risks, losses and costs associated with investing, including total loss of principal, are your responsibility. The views and opinions expressed in this article are those of the authors and do not necessarily reflect the official policy or position of FXStreet nor its advertisers. The author will not be held responsible for information that is found at the end of links posted on this page.

If not otherwise explicitly mentioned in the body of the article, at the time of writing, the author has no position in any stock mentioned in this article and no business relationship with any company mentioned. The author has not received compensation for writing this article, other than from FXStreet.

FXStreet and the author do not provide personalized recommendations. The author makes no representations as to the accuracy, completeness, or suitability of this information. FXStreet and the author will not be liable for any errors, omissions or any losses, injuries or damages arising from this information and its display or use. Errors and omissions excepted.

The author and FXStreet are not registered investment advisors and nothing in this article is intended to be investment advice.

Recommended content


Recommended content

Editors’ Picks

AUD/USD remained bid above 0.6500

AUD/USD remained bid above 0.6500

AUD/USD extended further its bullish performance, advancing for the fourth session in a row on Thursday, although a sustainable breakout of the key 200-day SMA at 0.6526 still remain elusive.

AUD/USD News

EUR/USD faces a minor resistance near at 1.0750

EUR/USD faces a minor resistance near at 1.0750

EUR/USD quickly left behind Wednesday’s small downtick and resumed its uptrend north of 1.0700 the figure, always on the back of the persistent sell-off in the US Dollar ahead of key PCE data on Friday.

EUR/USD News

Gold holds around $2,330 after dismal US data

Gold holds around $2,330 after dismal US data

Gold fell below $2,320 in the early American session as US yields shot higher after the data showed a significant increase in the US GDP price deflator in Q1. With safe-haven flows dominating the markets, however, XAU/USD reversed its direction and rose above $2,340.

Gold News

Bitcoin price continues to get rejected from $65K resistance as SEC delays decision on spot BTC ETF options

Bitcoin price continues to get rejected from $65K resistance as SEC delays decision on spot BTC ETF options

Bitcoin (BTC) price has markets in disarray, provoking a broader market crash as it slumped to the $62,000 range on Thursday. Meanwhile, reverberations from spot BTC exchange-traded funds (ETFs) continue to influence the market.

Read more

US economy: slower growth with stronger inflation

US economy: slower growth with stronger inflation

The dollar strengthened, and stocks fell after statistical data from the US. The focus was on the preliminary estimate of GDP for the first quarter. Annualised quarterly growth came in at just 1.6%, down from the 2.5% and 3.4% previously forecast.

Read more

Forex MAJORS

Cryptocurrencies

Signatures