|

Gold Price Forecast: XAU/USD exposes to $1,850 as yields strengthen amid hawkish Fed bets

  • Gold price is expected to continue its downside journey to near $1,850.00 as US yields have strengthened.
  • The speech from Fed chair Jerome Powell will provide the likely monetary policy action ahead.
  • Goldman Sachs sees two more interest rate hikes by the Fed in March and May.

Gold price (XAU/USD) has resumed its downside journey after a short-lived pullback to near $1,870.00 in the Asian session. The precious metal is exposed to the critical support of $1,850.00 amid a decline in US government bonds. The 10-year US Treasury yields have escalated their recovery to near 3.57%.

S&P500 futures are showing further losses, portraying a significant drop in the risk appetite of the market participants. The US Dollar Index (DXY) aims to scale above 102.80 amid the risk aversion theme. Investors are dumping United States equities as the impressive US employment will compel the Federal Reserve (Fed) the continuation of policy tightening, which will strengthen US recession fears.

For further guidance, the street will focus on the speech from Fed chair Jerome Powell, scheduled for Tuesday. Fed Powell is expected to sound hawkish on interest rate guidance amid an extremely tight labor market.

In its client note, the Goldman Sachs Research team expects the Fed to hike interest rates by 25 basis points (bps) consecutively in March and May. This way, the central bank will reach the terminal rate of 5.00-5.25%. The client note claims that the Gross Domestic Growth (GDP) growth will slow to 1.4% in 2023, reflecting a negative impact from tighter financial conditions.

Gold technical analysis

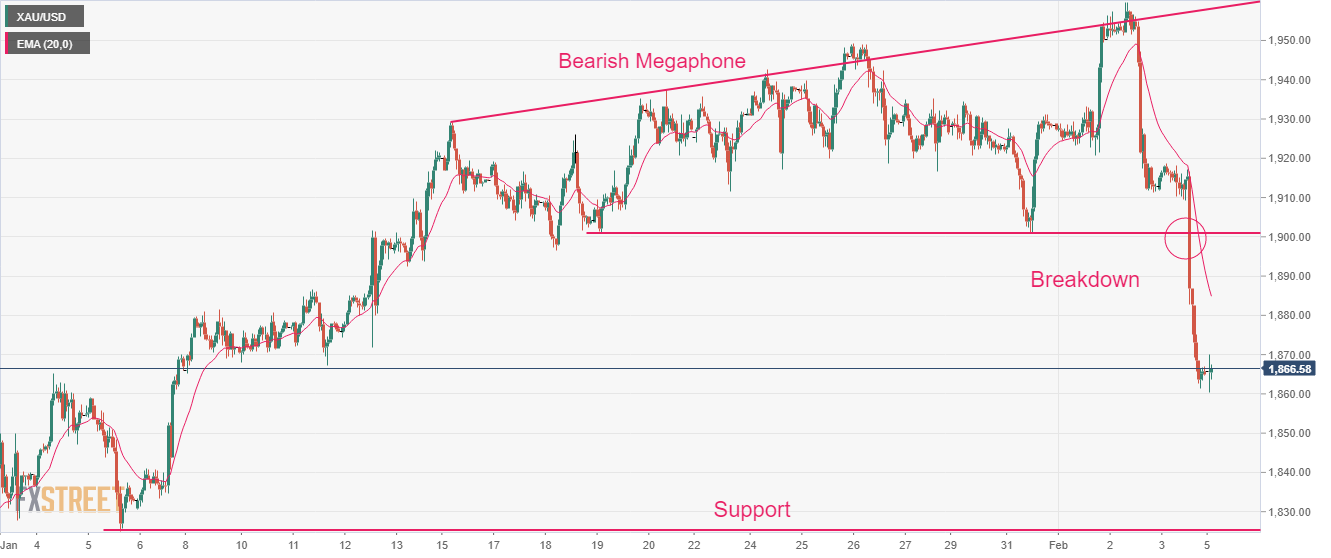
Gold price has demonstrated a nosedive move after delivering a breakdown of the Bearish Megaphone chart pattern that replicates a broadening triangle. The Gold price might find a cushion around the potential support from the January 5 low of around $1,825.08.

The precious metal has highly diverged from the 20-period Exponential Moving Average (EMA). Therefore a mean reversion to the former cannot be ruled out. However, the bearish trend-following action will continue amid the absence of any recovery signals yet.

The Relative Strength Index (RSI) (14) oscillates in the bearish range of 20.00-40.00, portraying that the downside momentum is extremely solid.

Gold hourly chart
XAU/USD

Overview
Today last price1866.3
Today Daily Change1.44
Today Daily Change %0.08
Today daily open1864.86
 
Trends
Daily SMA201914.36
Daily SMA501846.04
Daily SMA1001766.47
Daily SMA2001775.99
 
Levels
Previous Daily High1918.65
Previous Daily Low1861.45
Previous Weekly High1959.8
Previous Weekly Low1861.45
Previous Monthly High1949.27
Previous Monthly Low1823.76
Daily Fibonacci 38.2%1883.3
Daily Fibonacci 61.8%1896.8
Daily Pivot Point S11844.66
Daily Pivot Point S21824.45
Daily Pivot Point S31787.46
Daily Pivot Point R11901.86
Daily Pivot Point R21938.85
Daily Pivot Point R31959.06

Author

Sagar Dua

Sagar Dua

FXStreet

Sagar Dua is associated with the financial markets from his college days. Along with pursuing post-graduation in Commerce in 2014, he started his markets training with chart analysis.


More from Sagar Dua
Share:

Editor's Picks

GBP/USD bounces off four-day lows, still below 1.3500

GBP/USD sticks to the bearish tone on Thursday, coming down to the 1.3480 region in the latter part of the NA session. In the meantime, Cable’s weakness comes as investors continue to assess mixed UK data, poor US results, and the persistent uncertainty surrounding the US-Iran conflict.

EUR/USD looks apathetic around 1.1530

EUR/USD reverses Wednesday’s downtick and trades with modest gains in the 1.1530 region following the end of the NA session on Thursday. The pair’s tepid advance comes on the back of the absence of clear direction in the US Dollar despite tensions from the Middle East appear far from alleviated. Later on Friday, investors are expected to monitor the the releases of another revision of GDP figures in the Euroland, US Retail Sales and the preliminary U-Mich gauge.

Gold loses the grip, recedes toward $4,350

Gold extends its intraday pullback on Thursday, retesting the $4,350 zone per troy ounce, or three-day troughs. Meanwhile, the yellow metal continues to monitor developments from the Middle East as well as bets surrounding the potential Fed’s rate path.

Ethereum Price Forecast: Fidelity plans to add staking to ETH ETF amid yield debate
Asset manager Fidelity has filed with the US Securities and Exchange Commission (SEC) to permit staking in its Ethereum (ETH) exchange-traded fund (ETF), the Fidelity Ethereum Fund (FETH), which holds over $898 million in net assets.
Why credit markets aren’t pricing $570B of AI debt

Forecasts put global artificial intelligence related debt issuance near $570 billion this year, with roughly $236 billion of it priced by the end of May at four times the prior year's pace. Data centre securitisation alone has gone from about $4 billion a year through 2022 to roughly $10 billion in each of 2023 and 2024, and then $27 billion in 2025.

Why is Crude Oil priced for a reopening the ships haven't made?
Fourteen vessels crossed the Strait of Hormuz on Tuesday. Before the war, the count ran near 120 a day. In the sessions since the waterway was publicly declared open, Brent has drifted back to $87 and West Texas Intermediate (WTI) to $81, both a little lower again on Wednesday, with daily momentum on each unwound from the top of its range in late July to the low twenties now.














