Gold Price Forecast: XAU/USD drops further to test 50 DMA amid notable USD demand


Share:
  • Gold Price erases Friday’s rebound to test the crtiical 50 DMA at $1,782.
  • China-led risk-aversion inspires the US dollar rally while yields recover.
  • Focus shifts to US Retail Sales and Fed minutes for the next big move in XAU/USD.

Gold Price is tumbling towards the $1,780 level in European trading, having struggled around $1,800 earlier in the Asian session.

The risk-off market profile remains at full steam after Chinese activity came in below forecasts and fuelled growth concerns. Further, unexpected rate cuts by the PBOC amplified concerns over an economic slowdown in the world’s second-largest economy. Investors seek refuge in the US dollar amid the market panic, as US-Sino tensions also remain rife. A US congressional delegation arrived in Taiwan on Sunday, less than two weeks after the contentious visit by House Speaker Nancy Pelosi,

Also read: Gold Price Forecast: XAU/USD closes the week above 50 DMA, what’s next?

The greenback also finds fresh support from the renewed uptick in the US Treasury yields, as investors reassess Fed tightening expectations after Friday’s strong Michigan Consumer Sentiment Index. The preliminary August estimate of the UoM consumer sentiment index rose to three-month highs of 3.6 points to 55.1 from a July reading of 51.5. The inflation expectations sub-index eased, which triggered a sharp risk rally on Wall Street.

In absence of the first-tier US economic release, the Fed rate hike expectations and risk trends will have a significant impact on the bright metal. The main event risk for this week is Wednesday’s FOMC minutes, which will set a fresh direction for the bullion if it hints at the Fed’s future policy path.

Gold Price: Daily chart

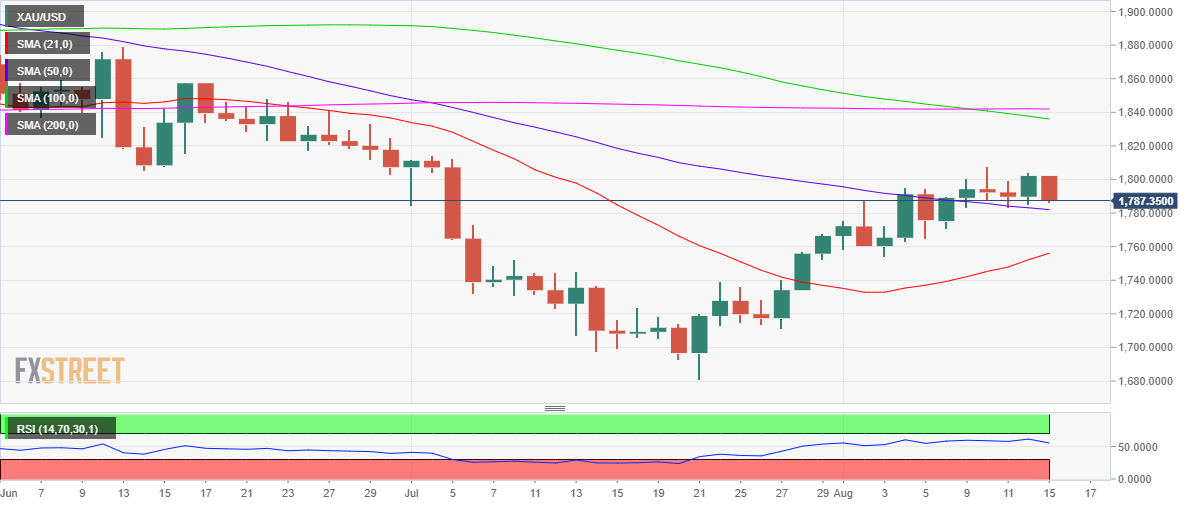
Daily closing below the 50-Daily Moving Average (DMA) resistance-turned-support at $1,782 is critical to offsetting the recent recovery momentum. Bears will then look out for the $1,770 round figure, below which the 21 DMA at $1,756 will be tested.

On the upside, another strong attempt above the $1,800 mark will probe the monthly high of $1,808, above which fresh buying opportunities will emerge.

Gold Price: Additional levels to consider

XAU/USD

Overview
Today last price 1786.95
Today Daily Change -15.15
Today Daily Change % -0.84
Today daily open 1802.11
 
Trends
Daily SMA20 1754.49
Daily SMA50 1783.14
Daily SMA100 1837.71
Daily SMA200 1842.1
 
Levels
Previous Daily High 1804.04
Previous Daily Low 1784.95
Previous Weekly High 1807.93
Previous Weekly Low 1770.9
Previous Monthly High 1814.37
Previous Monthly Low 1680.91
Daily Fibonacci 38.2% 1796.75
Daily Fibonacci 61.8% 1792.24
Daily Pivot Point S1 1790.03
Daily Pivot Point S2 1777.94
Daily Pivot Point S3 1770.94
Daily Pivot Point R1 1809.12
Daily Pivot Point R2 1816.12
Daily Pivot Point R3 1828.21


Share: Feed news

Information on these pages contains forward-looking statements that involve risks and uncertainties. Markets and instruments profiled on this page are for informational purposes only and should not in any way come across as a recommendation to buy or sell in these assets. You should do your own thorough research before making any investment decisions. FXStreet does not in any way guarantee that this information is free from mistakes, errors, or material misstatements. It also does not guarantee that this information is of a timely nature. Investing in Open Markets involves a great deal of risk, including the loss of all or a portion of your investment, as well as emotional distress. All risks, losses and costs associated with investing, including total loss of principal, are your responsibility. The views and opinions expressed in this article are those of the authors and do not necessarily reflect the official policy or position of FXStreet nor its advertisers. The author will not be held responsible for information that is found at the end of links posted on this page.

If not otherwise explicitly mentioned in the body of the article, at the time of writing, the author has no position in any stock mentioned in this article and no business relationship with any company mentioned. The author has not received compensation for writing this article, other than from FXStreet.

FXStreet and the author do not provide personalized recommendations. The author makes no representations as to the accuracy, completeness, or suitability of this information. FXStreet and the author will not be liable for any errors, omissions or any losses, injuries or damages arising from this information and its display or use. Errors and omissions excepted.

The author and FXStreet are not registered investment advisors and nothing in this article is intended to be investment advice.

Follow us on Telegram

Stay updated of all the news

Join Telegram

Recommended content


Follow us on Telegram

Stay updated of all the news

Join Telegram

Recommended content

Editors’ Picks

EUR/USD loses traction, retreats below 1.0600

EUR/USD loses traction, retreats below 1.0600

EUR/USD lost its recovery momentum and declined below 1.0600 in the American session on Friday, erasing a portion of its daily gains in the process. Nevertheless, the risk-positive market atmosphere after PCE inflation data helps the pair limit its losses.

EUR/USD News

GBP/USD turns negative on the day below 1.2200

GBP/USD turns negative on the day below 1.2200

GBP/USD reversed its direction and slumped below 1.2200 in the American session on Friday after rising above 1.2270 earlier in the day. Position readjustments and profit-taking on the last trading day of the quarter seems to be weighing on Pound Sterling.

GBP/USD News

Gold reverses direction, drops below $1,860

Gold reverses direction, drops below $1,860

Following a steady rebound toward $1,880 on Friday, Gold price made a sharp U-turn and turned negative on the day near $1,860. Although the 10-year US T-bond yield is down more than 1%, XAU/USD struggles to find demand on the last day of Q3.

Gold News

Polkadot Price Forecast: DOT reversal seems inevitable after 92% correction from all-time high

Polkadot Price Forecast: DOT reversal seems inevitable after 92% correction from all-time high

Polkadot price, in nearly two years, has shed 92.91% from its all-time high of $55.09. The massive downswing in DOT has pushed it down to levels that were last seen in October 2020. Hence, the chances of this altcoin forming a bottom and rallying are high. 

Read more

Earnings beat triggers Nike to spike 9%

Earnings beat triggers Nike to spike 9%

Nike (NKE) stock has surged over 9% in Friday’s premarket, climbing above $98 per share, following late Thursday’s fiscal first-quarter earnings release. Nike beat pessimistic earnings expectations by more than 23% and hiked its dividend by 9%.

Read more

Forex MAJORS

Cryptocurrencies

Signatures