Gold Price Forecast: XAU/USD bears need validation from $1,644 – Confluence Detector
- Gold price pares the biggest daily jump in three weeks, retreats from one-week high.
- US dollar regains upside momentum after the first weekly loss in three.
- Sour sentiment, hawkish Fed bets underpin DXY rebound ahead of the key US PMI, Q3 GDP.
- XAU/USD stays on the bear’s radar but $1,644 may offer an intermediate halt.

Gold price (XAU/USD) remains mildly offered while paring the previous day’s run-up from a monthly low. In doing so, the yellow metal tests the bearish commitments amid a fortnight-long absence of the Fed speakers ahead of November Federal Open Market Committee (FOMC). That said, geopolitical fears surrounding the US-China and the Russia-Ukraine subjects joined chatters surrounding Japanese policymakers’ market intervention to recall the US dollar buyers. On the same line could be the fresh jump in the hawkish Fed bets, as well as China’s covid woes, not to forget the political jitters in the UK and between North and South Korea. It should, however, be noted that the cautious mood ahead of the preliminary activity numbers for October and the key central bank meetings, as well as the US Gross Domestic Product for the third quarter (Q3), seems to challenge the gold bears of late.
Also read: Gold Price Forecast: XAU/USD treads water as hopes of Fed slowdown offset stronger USD
Gold Price: Key levels to watch
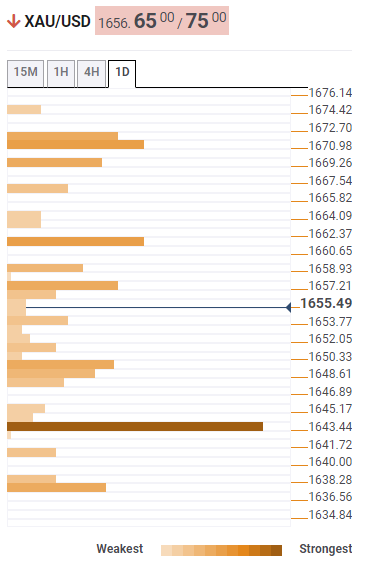
The Technical Confluence Detector shows that the gold price remains above the $1,644 key support despite the latest pullback from a one-week high. The stated level comprises the Fibonacci 38.2% on one-day, 5-DMA and Fibonacci 23.6% on one month.
Also acting as minor support is the convergence of the 50-HMA and lower band of the Bollinger on the four-hour play, as well as the Fibonacci 61.8% on weekly, around $1,636.
In a case where the XAU/USD prices remain weak past $1,636, the odds of witnessing a slump towards the latest swing low near $1,617 and the yearly low of $1,614 can’t be ruled out.
Alternatively, recovery moves may initially dribble around the $1,662 level encompassing Fibonacci 38.2% monthly.
Following that, pivot point one-day R1, SMA 100 on the 4H and upper band of the hourly Bollinger, near $1,672, will be important to watch for fresh impulse as the break of which could quickly direct the XAU/USD bulls towards the $1,700 threshold.
Here is how it looks on the tool
About Technical Confluences Detector
The TCD (Technical Confluences Detector) is a tool to locate and point out those price levels where there is a congestion of indicators, moving averages, Fibonacci levels, Pivot Points, etc. If you are a short-term trader, you will find entry points for counter-trend strategies and hunt a few points at a time. If you are a medium-to-long-term trader, this tool will allow you to know in advance the price levels where a medium-to-long-term trend may stop and rest, where to unwind positions, or where to increase your position size.
Author

Anil Panchal
FXStreet
Anil Panchal has nearly 15 years of experience in tracking financial markets. With a keen interest in macroeconomics, Anil aptly tracks global news/updates and stays well-informed about the global financial moves and their implications.

















