- Gold price grind near the key hurdle after refreshing four-month high.
- Hopes of slower Federal Reserve rate hikes drowned the United States Treasury bond yields, US Dollar and favored XAU/USD.
- Optimism surrounding China also allowed Gold buyers to keep the reins.
- United States Nonfarm Payrolls will be crucial amid talks of Fed’s 50 bps rate hike in December.
Gold price (XAU/USD) refreshed a four-month high above $1,800 before taking rounds to $1,805-07 during early Friday morning in Asia. In doing so, the yellow metal portrays the market’s cautious mood ahead of the key catalysts. Also likely to have probed the Gold buyers could be the recently mixed updates from the Fed, as well as the data from the United States.
Dovish Federal Reserve drowns the United States Treasury bond yields, US Dollar and Gold Price
The dovish bias of the Federal Reserve (Fed) Chairman Jerome Powell, as well as downbeat comments from US Treasury Secretary Janet Yellen, initially raised hopes of easy rate hikes.
Recently, Federal Reserve (Fed) Governor Michelle Bowman stated that (It is) appropriate for us to slow the pace of increases. Before him, Fed Governor Jerome Powell also teased the slowing of a rate hike while US Treasury Secretary Yellen also advocated for a soft landing. Further, Vice Chair of supervision, Michael Barr, also said, “We may shift to a slower pace of rate increases at the next meeting.” It’s worth noting that the recent comments from New York Fed’s John Williams seemed to have tested the US Dollar bears as the policymakers stated that the Fed has a ways to go with rate rises.
The comments favoring a 50 bps Fed rate hike in December allowed the US Treasury bond yields to refresh a four-month low amid receding market pessimism and a rush toward the riskier assets.
It’s worth noting, however, that the Bank of Japan’s (BOJ) hints of adjusting the easy money policies seemed to have challenged the bond yields of late amid fears of less demand from the biggest customer in Asia.
That said, the benchmark US 10-year Treasury bond yields slumped to 3.50% while the two-year counterpart printed 4.23% while poking the lowest levels since October by the press time.
With this, US Dollar Index (DXY) slumped to the lowest levels in four months, pressured around 104.70 at the latest.
China’s Covid conditions, mostly downbeat United States data also weigh on XAU/USD
The consecutive three days of the downtrend of Chinese daily Covid infections from a record high allowed the policymakers to tease the “next stage” in battling the virus while announcing multiple easing of the activity-control measures.
Elsewhere, US Core Personal Consumption Expenditures (PCE) Price Index, the Federal Reserve’s preferred inflation gauge, matched 5.0% market forecasts on YoY but eased to 0.2% MoM versus 0.3% expected. Further, US ISM Manufacturing PMI for November eased to 49.0 versus 49.7 expected and 50.2 prior.
US Nonfarm Payrolls are the key for Gold buyers
While the aforementioned catalysts are well in place to weigh on the Gold price, it’s the market’s anxiety ahead of the US employment report for November that probes XAU/USD bulls of late, especially when the Fed is dovish.
Forecasts suggest that the headlines Nonfarm Payrolls (NFP) is likely to ease with a 200K print versus 261K prior while the Unemployment Rate could remain unchanged at 3.7%. It should be noted that a likely easing in the Average Hourly Earnings for the stated month could also weigh on the Gold price.
Hence, a downbeat US jobs report may allow the XAU/USD buyers to keep the reins. However, the historical analysis suggests fading of NFP-led moves within four hours and hence any surprises might not harm the latest moves of the yellow metal.
Also read: US November Nonfarm Payrolls Preview: Analyzing gold's reaction to NFP surprises
Gold price technical analysis
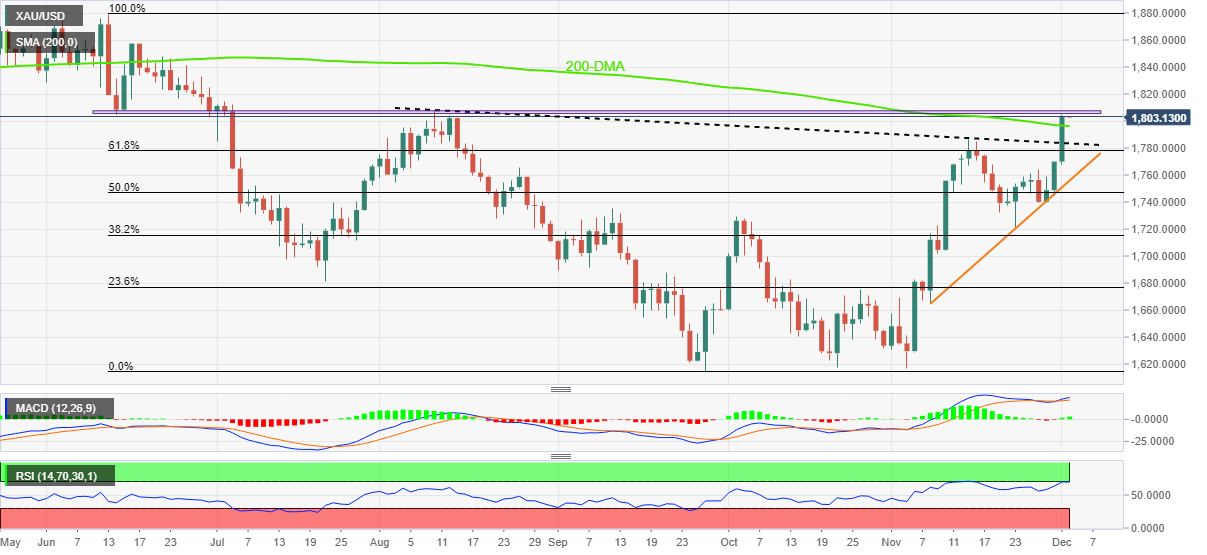
Gold buyers take a breather at the highest levels since early August amid the overbought conditions of the Relative Strength Index (RSI) line, placed at 14. Also challenging the metal buyers is the horizontal area surrounding $1,805-07 comprising multiple levels marked since mid-June.
That said, the Moving Average Convergence and Divergence (MACD) indicator’s bullish signals join the previous day’s upside break of the 200-Day Moving Average (DMA) and a downward-sloping trend line from August to keep the Gold price on the bull’s radar.
Hence, a clear upside break of the $1,807 appears necessary for the bullion to let the buyers sit in the driver’s seat. Following that, a run-up toward a mid-June high of $1,858 and then to June’s peak surrounding $1,880 can’t be ruled out.
Alternatively, pullback moves remain elusive unless the quote stays beyond the 200-DMA level near $1,796, a break of which could quickly drag the Gold price towards the resistance-turned-support line from early August, close to $1,782 at the latest.
In a case where the XAU/USD remains weak past $1,782, a one-month-old ascending support line near $1,758 will be crucial for the Gold traders to watch as it holds the key to the bear’s entry.
Gold price: Daily chart
Trend: Further upside expected
Information on these pages contains forward-looking statements that involve risks and uncertainties. Markets and instruments profiled on this page are for informational purposes only and should not in any way come across as a recommendation to buy or sell in these assets. You should do your own thorough research before making any investment decisions. FXStreet does not in any way guarantee that this information is free from mistakes, errors, or material misstatements. It also does not guarantee that this information is of a timely nature. Investing in Open Markets involves a great deal of risk, including the loss of all or a portion of your investment, as well as emotional distress. All risks, losses and costs associated with investing, including total loss of principal, are your responsibility. The views and opinions expressed in this article are those of the authors and do not necessarily reflect the official policy or position of FXStreet nor its advertisers. The author will not be held responsible for information that is found at the end of links posted on this page.
If not otherwise explicitly mentioned in the body of the article, at the time of writing, the author has no position in any stock mentioned in this article and no business relationship with any company mentioned. The author has not received compensation for writing this article, other than from FXStreet.
FXStreet and the author do not provide personalized recommendations. The author makes no representations as to the accuracy, completeness, or suitability of this information. FXStreet and the author will not be liable for any errors, omissions or any losses, injuries or damages arising from this information and its display or use. Errors and omissions excepted.
The author and FXStreet are not registered investment advisors and nothing in this article is intended to be investment advice.
Recommended content
Editors’ Picks
EUR/USD tests the major level of 1.0650; followed by the nine-day EMA

EUR/USD remains lackluster during the early Tuesday, hovering near 1.0650. From a technical perspective, analysis suggests a bearish sentiment for the pair as it struggles below the pullback resistance at the 1.0695 level.
GBP/USD: Flat lines around mid-1.2300s, bearish potential seems intact

GBP/USD holds steady on Tuesday amid subdued USD demand, albeit lacks bullish conviction. The divergent Fed-BoE policy expectations turn out to be a key factor acting as a headwind. The technical setup suggests that the path of least resistance for the pair is to the downside.
Gold could see a rebound before resuming the correction

Gold price sees a fresh leg down in Asia on Tuesday even as risk flows dissipate. Receding fears over Middle East escalation offset subdued US Dollar and Treasury bond yields. Gold remains heavily oversold on the 4H chart, rebound appears in the offing.
PENDLE price soars 10% after Arthur Hayes’ optimism on Pendle derivative exchange

Pendle price is among the top performers in the cryptocurrency market today, posting double-digit gains. Its peers in the altcoin space are not as forthcoming even as the market enjoys bullish sentiment inspired by Bitcoin price.
After Monday's relief rally, attention shifts to earnings and policy fronts

With the easing of tensions in the Middle East, safe-haven demand reversed course; global stock markets experienced a modicum of relief. Indeed, in a classic relief rally fashion, Monday saw a rebound in the S&P 500, snapping a six-day losing streak.