NASDAQ plunges 5% on Friday, ending worst week since April
- NASDAQ experiences worst performance since April, down 10% on the week.
- Nvidia accounting investigation sends shares south of $130.
- SNDK, MU, BE, DELL, AMD tank as investors rush to safe-havens.


The NASDAQ Composite's (IXIC) terrible week got much worse on Friday. With the index now down for five out of the last six weeks, the NASDAQ hemorrhaged another 4.6% by late afternoon. The index is trading near 22,930, erasing all its gains from the past seven months.
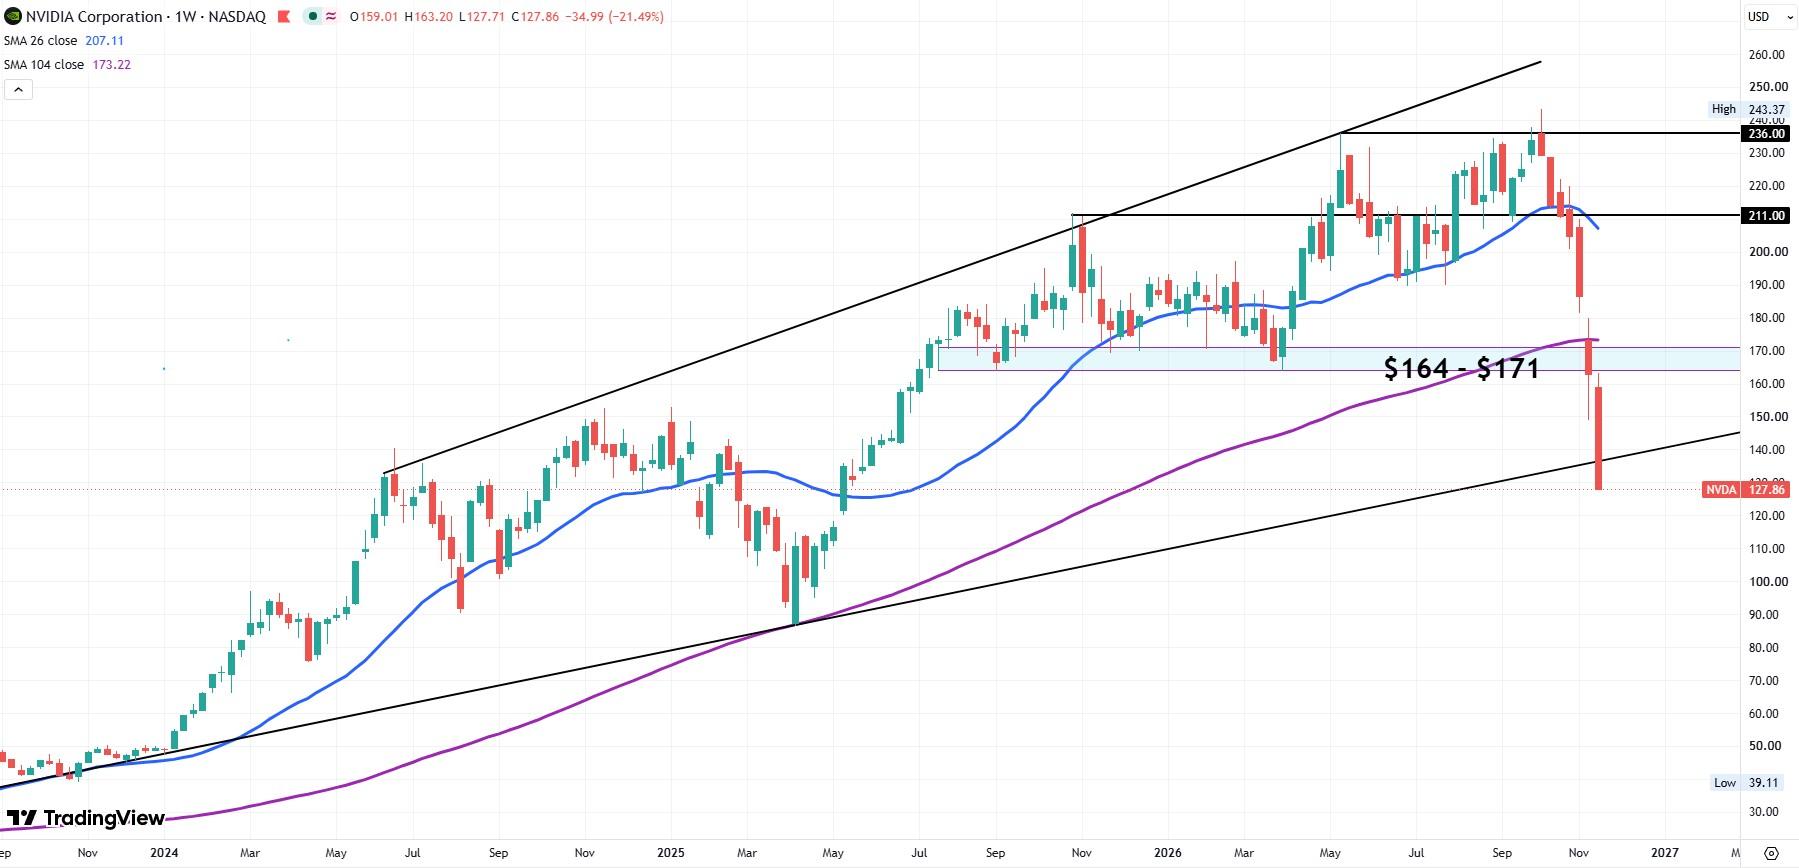
The AI trade was the primary culprit of Friday's intense selling. Nvidia (NVDA) sank about 11% to $128, erasing all of the gains since May 2025, after Reuters reported that the Securities & Exchange Commission (SEC) was investigating accounting at Jensen Huang's former company. Democratic lawmakers are also probing Nvidia's relationship to a Commerce Department investigation into Megaspeed, the company alleged to be dodging US export controls on AI chips to China.
Nvidia stock is now down more than 23% this week.
Despite locking in a double-digit performance on its first day of trading on Thursday, Anthropic shares also collapsed more than 10%, nearly testing the $83 price tag for the IPO.
Memory chipmakers Micron (MU) and Sandisk (SNDK) both fell around 15%, while Bloom Energy (BE), Advanced Micro Devices (AMD), Broadcom (AVGO) and Dell Technologies (DELL) saw double-digit losses.
NASDAQ falls as investors see bad signs in their charts
Citi analysts were quick to get the fear churning on Friday with a report that talked about bearish factor analysis. Based on performance between, quality, value and momentum stocks, the analysts said they saw an environment reminiscent of the DotCom and Covid busts.
Others speculated that the market's poor performance was the continued realization that the "Trump put" was over. When tariffs in 2025 or the Iran War in 2026 got out of hand, President Donald Trump responded with policies that righted the ship for equity markets. However, many believe that the incoming divided Congress will mean that Trump will lose his ability to stabilize markets.
Democrats' landslide win also continues to place overhead pressure on the AI trade as many Democratic state lawmakers ran on pausing or slowing down the buildout of AI data centers. While most analysts don't believe the slowdown will arrive until 2028, many investors have decided any bad news for AI is cause for exiting the trade.
With long-term Treasuries offering over 5% yields, a greater share of institutional investors are deciding to wait out this moment of weakness.
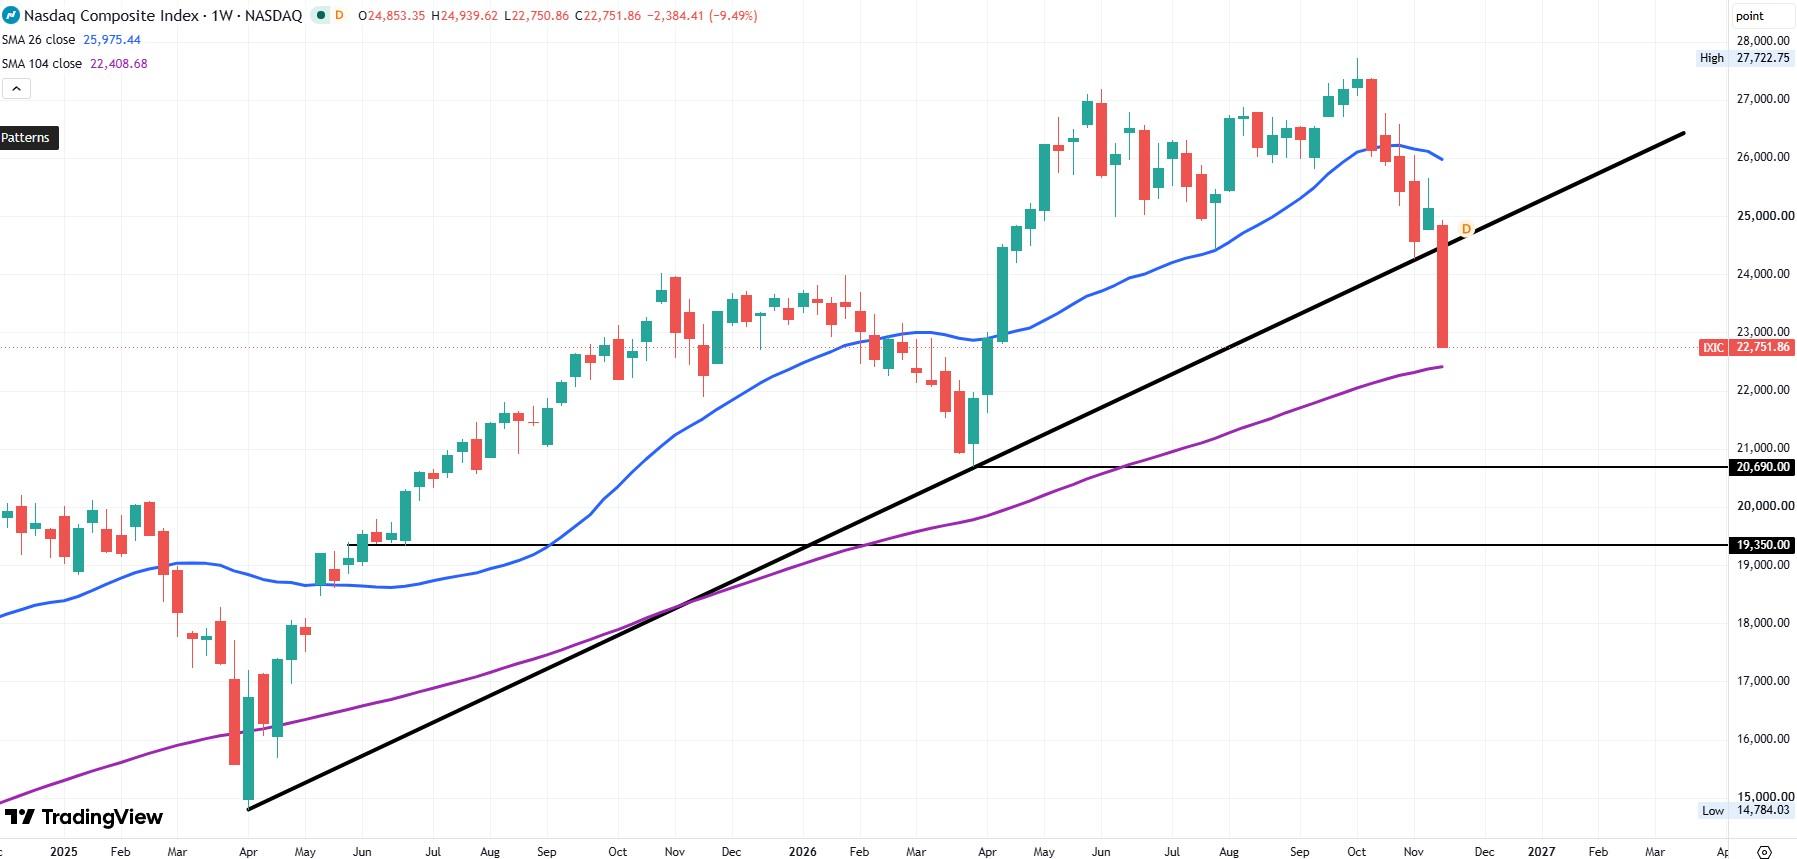
NASDAQ weekly chart
The NASDAQ Composite broke confidently through the ascending bottom trendline this week. The index is off about 10% this week alone, which is quite unusual. However, the last time the index fell that swiftly was the first week of April 2026, which was the last week before the Trump administration paused the Iran War with its first ceasefire. That ceasefire then led to a dramatic rally that lasted until the summer.
There's no reason this level of selling won't lead the NASDAQ to that March-April range low near 20,690, but more immediately the 104-week (two year) Simple Moving Average (SMA) near 22,400 stands in the way. And this bear market is unlikely to quickly right itself. Expect further selling next week before consolidation arrives.
Author
Clay Webster
FXStreet
Clay Webster grew up in the US outside Buffalo, New York and Lancaster, Pennsylvania. He began investing after college following the 2008 financial crisis.

















