|

Gold Price Forecast: XAU/USD advances towards $1,730 despite a rebound in DXY, US NFP buzz

  • Gold price is marching towards the critical hurdle of $1,730.00 ahead of US NFP data.
  • A marginal decline in odds for a 75 bps rate hike has supported the gold bulls.
  • The Fed's long spell of rate hikes is responsible for lower US NFP projections.

Gold price (XAU/USD) has extended its gains above the immediate hurdle of $1,720.00 and is aiming to test a three-week high at around $1,730.00. The precious metal is scaling higher gradually as the US dollar index (DXY) has displayed a subdued performance. A rebound has been witnessed in the DXY after refreshing the day’s low around 110.80 but the soaring market mood will keep a lid over the DXY bulls.

The 10-year benchmark US Treasury yields have fallen below 3.75% amid a minor decline in bets for a 75 basis point (bps) interest rate hike by the Federal Reserve (Fed). Per the CME Fedwatch tool, the probability of 67.8% for a three-quarter-to-a-percent rate hike, recorded in early Tokyo, has slipped to 64.7% in the early European session.

Wednesday’s upbeat US ISM Non-Manufacturing PMI data and US Automatic Data Processing (ADP) Employment figures brought a significant rally in the DXY but have turned subdued ahead of US Nonfarm Payrolls (NFP) data. The payroll data is expected to decline to 250k vs. the former release of 315k. The spell of rate hikes by the Fed has forced the corporate to postpone their capacity expansion plans, resulting in weaker consensus for the labor additions data.

Gold technical analysis

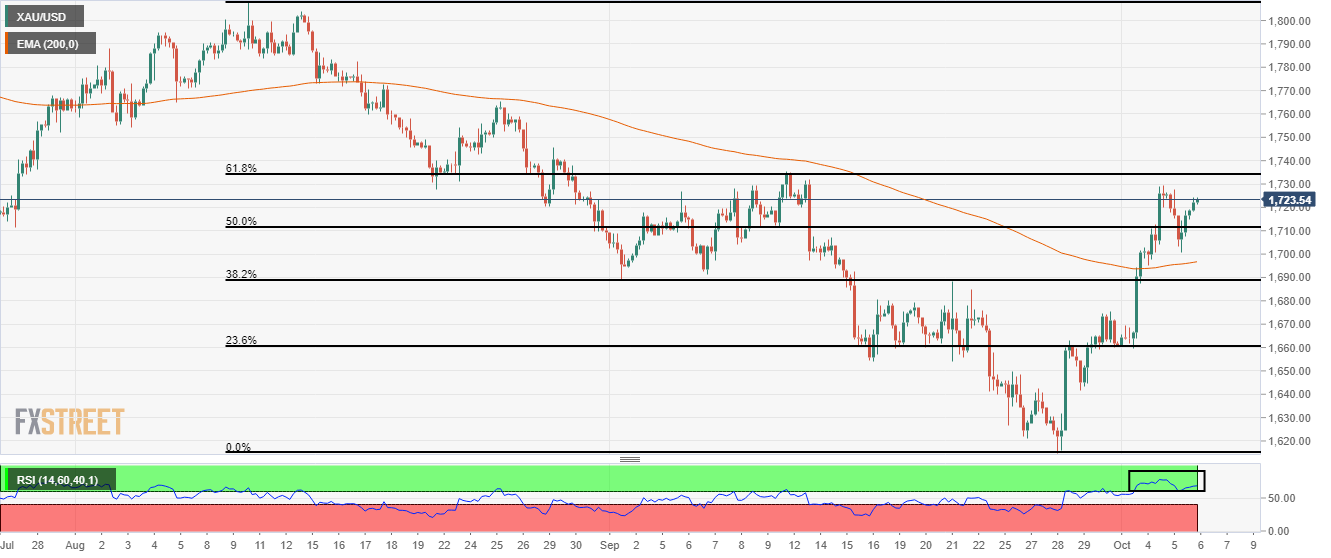
On an hourly scale, gold prices are marching towards the 61.8% Fibonacci retracement (from August 10 high at $1,807.93 to September low at $1,614.85) at $1,734.58. The 200-period Exponential Moving Average (EMA) at $1,697.00 has tilted towards the north, which indicates more upside ahead.

Meanwhile, the Relative Strength Index (RSI) (14) has picked demand at 60.00, which indicates that the market participants have capitalized on the pullback move for creating longs.

Gold four-hour chart

XAU/USD

Overview
Today last price1723.93
Today Daily Change7.68
Today Daily Change %0.45
Today daily open1716.25
 
Trends
Daily SMA201679.72
Daily SMA501724.38
Daily SMA1001762.48
Daily SMA2001823.19
 
Levels
Previous Daily High1727.85
Previous Daily Low1700.53
Previous Weekly High1675.49
Previous Weekly Low1614.85
Previous Monthly High1735.17
Previous Monthly Low1614.85
Daily Fibonacci 38.2%1710.97
Daily Fibonacci 61.8%1717.41
Daily Pivot Point S11701.9
Daily Pivot Point S21687.56
Daily Pivot Point S31674.58
Daily Pivot Point R11729.22
Daily Pivot Point R21742.2
Daily Pivot Point R31756.54

Author

Sagar Dua

Sagar Dua

FXStreet

Sagar Dua is associated with the financial markets from his college days. Along with pursuing post-graduation in Commerce in 2014, he started his markets training with chart analysis.

More from Sagar Dua
Share:

Editor's Picks

EUR/USD recovers some early losses driven by rising energy prices amid US-Iran war

The EUR/USD pair claws back some of its early losses during the late Asian trading session on Monday, but is still 0.25% down to near 1.1780. Earlier in the day, the Euro declined sharply against the US Dollar as investors shifted to the safe-haven fleet amid the brutal war between Iran, Israel, and the United States, which broke out over the weekend.

GBP/USD targets 1.3500 barrier near moving averages

GBP/USD rebounds from the daily losses, trading around 1.3450 during the Asian hours on Monday. The technical analysis of the daily chart indicates an ongoing bearish bias, as the pair trades within a descending channel pattern.

Gold looks further north as Iran war boosts haven demand

Gold is taking a breather after the initial run to over one-month highs near $5,400, kicking off the new week with a bang. A global flight to safety theme, following the US-Israel joint attacks on Iran over the weekend, bolstered the demand for the traditional store of value, Gold.

Bitcoin, Ethereum and Ripple under pressure as key supports face breakdown risk

Bitcoin, Ethereum, and Ripple prices trade on the back foot at the start of this week on Monday, after extending losses in the previous week. BTC is on the brink of a breakdown, ETH is capped below key resistance, and XRP risks a crack of the trendline.

The market is paying for insurance, not apocalypse

As expected, this morning felt less like a Monday market open and more like a fire drill. Futures screens flickered red. S&P contracts down almost 1%. Nasdaq off 1.2%. Brent leaped 13% through $80. Gold rose 1.6% toward $5350 before paring some gains. The dollar is strutting mildly. The Swiss franc is quietly doing what it always does in a storm, catching some safe-haven flows.

Starknet unveils strkBTC, shielded Bitcoin transactions on Ethereum Layer 2

Starknet, the Ethereum Layer 2 network developed by StarkWare, today announced strkBTC, a wrapped Bitcoin asset that introduces optional shielding while preserving full DeFi composability.