Gold Price Forecast: $1,790 remains a tough nut to crack ahead of Fed – Confluence Detector
- Gold price drops as the US dollar rises on a risk-off market profile.
- Wednesday’s Fed decision to provide the next decisive move in gold price.
- Gold at the mercy of the Fed, ascending triangle pattern in play.

Where is gold price headed? Markets are eagerly looking forward to the Fed decision, as the two-day FOMC meeting kicks off on Tuesday. Ahead of the Fed verdict, the Omicron covid variant fears have gripped the market, putting a fresh bid under the safe-haven US dollar at gold’s expense. Meanwhile, the Treasury yields hold steady on expectations of faster Fed’s tapering and hint at a mid-2022 rate hike.
Read: Gold Price Forecast: XAU/USD bull-bear tug-of-war likely to extend but upside risks likely
Gold Price: Key levels to watch
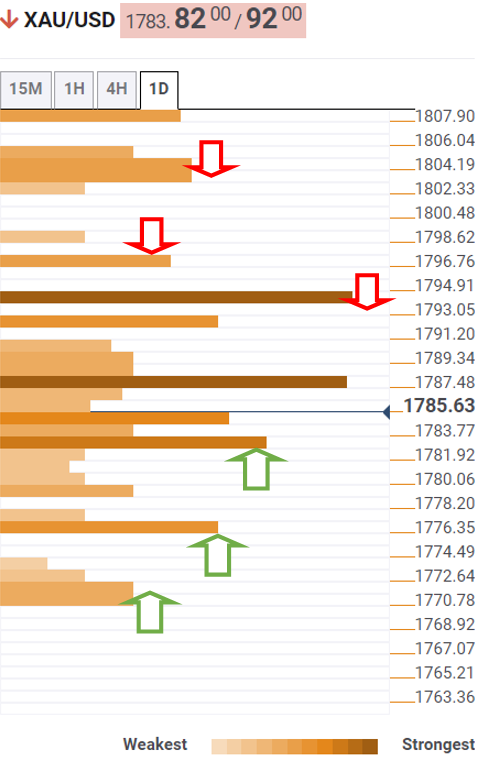
The Technical Confluences Detector shows that the gold price continues to run into strong offers at $1,790, which is the meeting point of the SMA100 one-day, Fibonacci 23.6% one-day and SMA100 four-hour.
A decisive break above the latter could unleash the additional recovery towards the next powerful resistance at $1,793. At that level, the SMA200 one-day coincides with the previous week’s high and pivot point one-week R1.
Gold bulls will then target $1,796, the confluence of the pivot point one-day R2 and SMA50 one-day.
A dense cluster of healthy resistance levels awaits at $1,804, the convergence of the Fibonacci 38.2% one-month, pivot point one-week R2 and pivot point one-day R3.
Alternatively, the selling momentum could accelerate below the pivot point one-day S1 at $1,781.
Gold bears will then challenge the downside target at $1,779, where the Fibonacci 38.2% one-week meets with the SMA10 one-day.
Further south, the intersection of the Fibonacci 161.8% and Fibonacci 23.6% one-week at $1,775.
The last line of defense for gold buyers is the previous week’s low of $1,770.
Here is how it looks on the tool
About Technical Confluences Detector
The TCD (Technical Confluences Detector) is a tool to locate and point out those price levels where there is a congestion of indicators, moving averages, Fibonacci levels, Pivot Points, etc. If you are a short-term trader, you will find entry points for counter-trend strategies and hunt a few points at a time. If you are a medium-to-long-term trader, this tool will allow you to know in advance the price levels where a medium-to-long-term trend may stop and rest, where to unwind positions, or where to increase your position size.
Author

Dhwani Mehta
FXStreet
Residing in Mumbai (India), Dhwani is a Senior Analyst and Manager of the Asian session at FXStreet. She has over 10 years of experience in analyzing and covering the global financial markets, with specialization in Forex and commodities markets.


