Gold Price attempts a rebound above $1,700 as DXY turns sideways, recovery seems obscure
- Gold price is aiming to recapture its intraday high at $1,710.21 amid lackluster DXY.
- A slippage in odds of a 1% rate hike by the Fed has failed to support the gold bulls.
- Lower consensus for S&P PMI data may bring a sell-off in the DXY.

Gold Price (XAUUSD) has rebounded modestly after remaining subdued in the Asian session. The precious metal has picked bids after hitting a low of $1,705.55 and is hovering around an intraday high at $1,710.21. The bright metal has remained sideways from the past week, auctioning in a wide range of $1,697.64-1,723.83 amid the unavailability of any potential trigger, which could guide further direction.
Meanwhile, the US dollar index (DXY) is displaying exhaustion signals after a pullback move. The asset rebounded gradually after hitting a low of 106.92 on Tuesday. Till now, the sentiment of bearish Monday has not carry-forwarded on Tuesday, however, the downside seems warranted as the DXY is struggling in establishment above 107.50. A downside move below Monday’s low at 106.92 is likely to bring a sell-off in the asset.
Also Read: Gold Price Forecast: Bulls hesitate despite a better market mood

Fed may not opt for a rate hike by 1%
Gold Price struggles despite lower odds for a 1% rate hike by the Fed
The odds of a 1% rate hike by the Federal Reserve (Fed) have trimmed vigorously. As per CME’s FedWatch Tool, the expectations of a rate hike by 1% were as high as 80% last week, which have trimmed to near 30%. Gold bulls have failed to capitalize on similar information and are struggling to drive higher. Odds of a 100 basis point (bps) interest rate hike for the July interest rate decision have trimmed after the release of the long-run inflation expectations. The economic data landed at 2.8% lower than June’s print of 3.1%.
Inflation rate to find its peak sooner
Higher inflation rates have weighed pressure on the margins of the companies and have impacted the earnings of the households. However, the price pressures will soon find their peak as lower oil prices in June and lower demand for durable goods by the households will fix the imbalance in the demand-price mechanism. The upbeat Retail Sales and other demand indicators were more driven by firmer price pressures rather than the aggregate demand by the households. Therefore, lower demand on the grounds of quantity will bring the inflation rate lower.
Policy to tighten further by other Western leaders
Gold price is expected to face tremendous pressures this week as monetary policies announcement from the European Central Bank (ECB) and the Bank of Japan (BOJ) will remain focused. The market participants are expecting a rate hike by the ECB for the first time in 11 years. Taking into account the soaring inflation rate due to higher energy bills, ECB President Christine Lagarde will announce a rate hike this time. Also, the minutes from the Reserve Bank of Australia (RBA) remained hawkish for further guidance. Therefore, the broader environment of policy tightening by the Western leaders will keep gold prices in check.
However, the Bank of Japan (BOJ) will continue with its dovish tone and will discuss measures on flushing liquidity into the economy to spurt the aggregate demand.
S&P Global PMI to remain in focus
Due to a light economic calendar this week, investors’ focus will remain on the release of the S&P Global PMI data. As per the market consensus, the economic catalysts are expected to deliver a weak performance. The Global Composite data is seen at 51.7, lower than the prior release of 52.3. The Manufacturing PMI may slip to 52 vs. 52.7 recorded earlier. While the Services PMI is expected to display a mild correction to 52.6 against the former figure of 52.7. This will keep the DXY on the back foot and may support the gold bulls.
-637938045255671259.png)
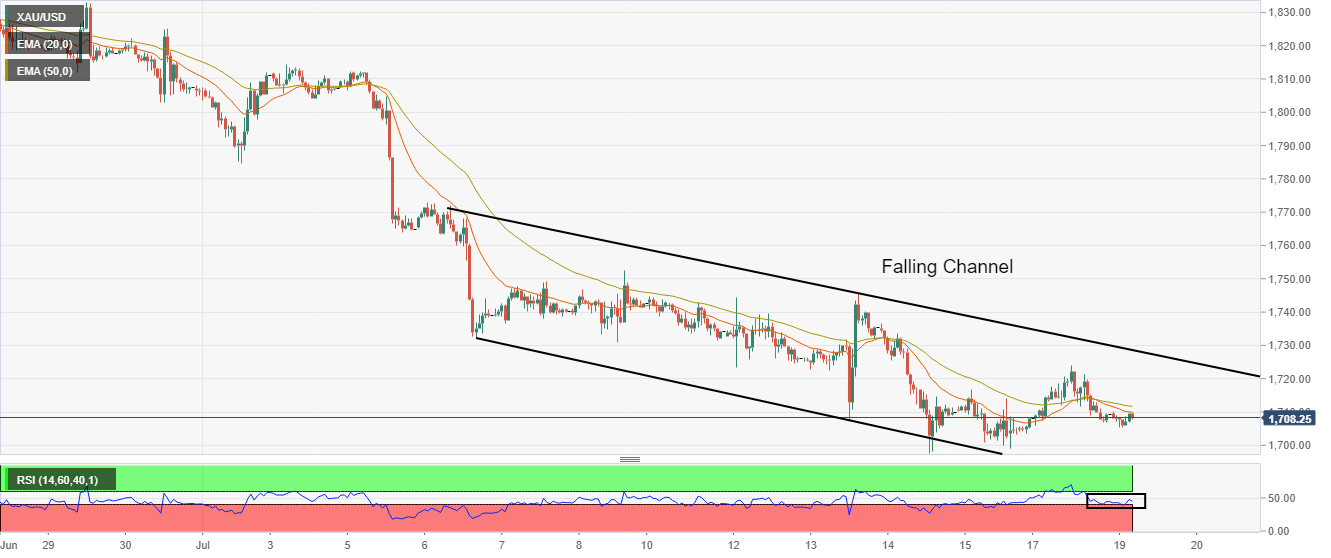
Gold technical analysis
Gold price has remained vulnerable for the whole month after surrendering the psychological support of $1.800.00. The precious metal is auctioning in a Falling Channel that indicates a bounded downside move. The upper portion and lower portion of the above-mentioned chart pattern are placed from July 6 high and low at $1,771.89 and $1,732.27 respectively.
A failed attempt of bullish crossover by the 20- and 50-period Exponential Moving Averages (EMAs) at $1,714.20 adds to the downside filters.
Meanwhile, the Relative Strength Index (RSI) (14) is holding itself above 40.00, however, the gold prices will remain on the tenterhooks.
Gold hourly chart
Gold halts decline, but bearish risks still intact
Author

Sagar Dua
FXStreet
Sagar Dua is associated with the financial markets from his college days. Along with pursuing post-graduation in Commerce in 2014, he started his markets training with chart analysis.


