|

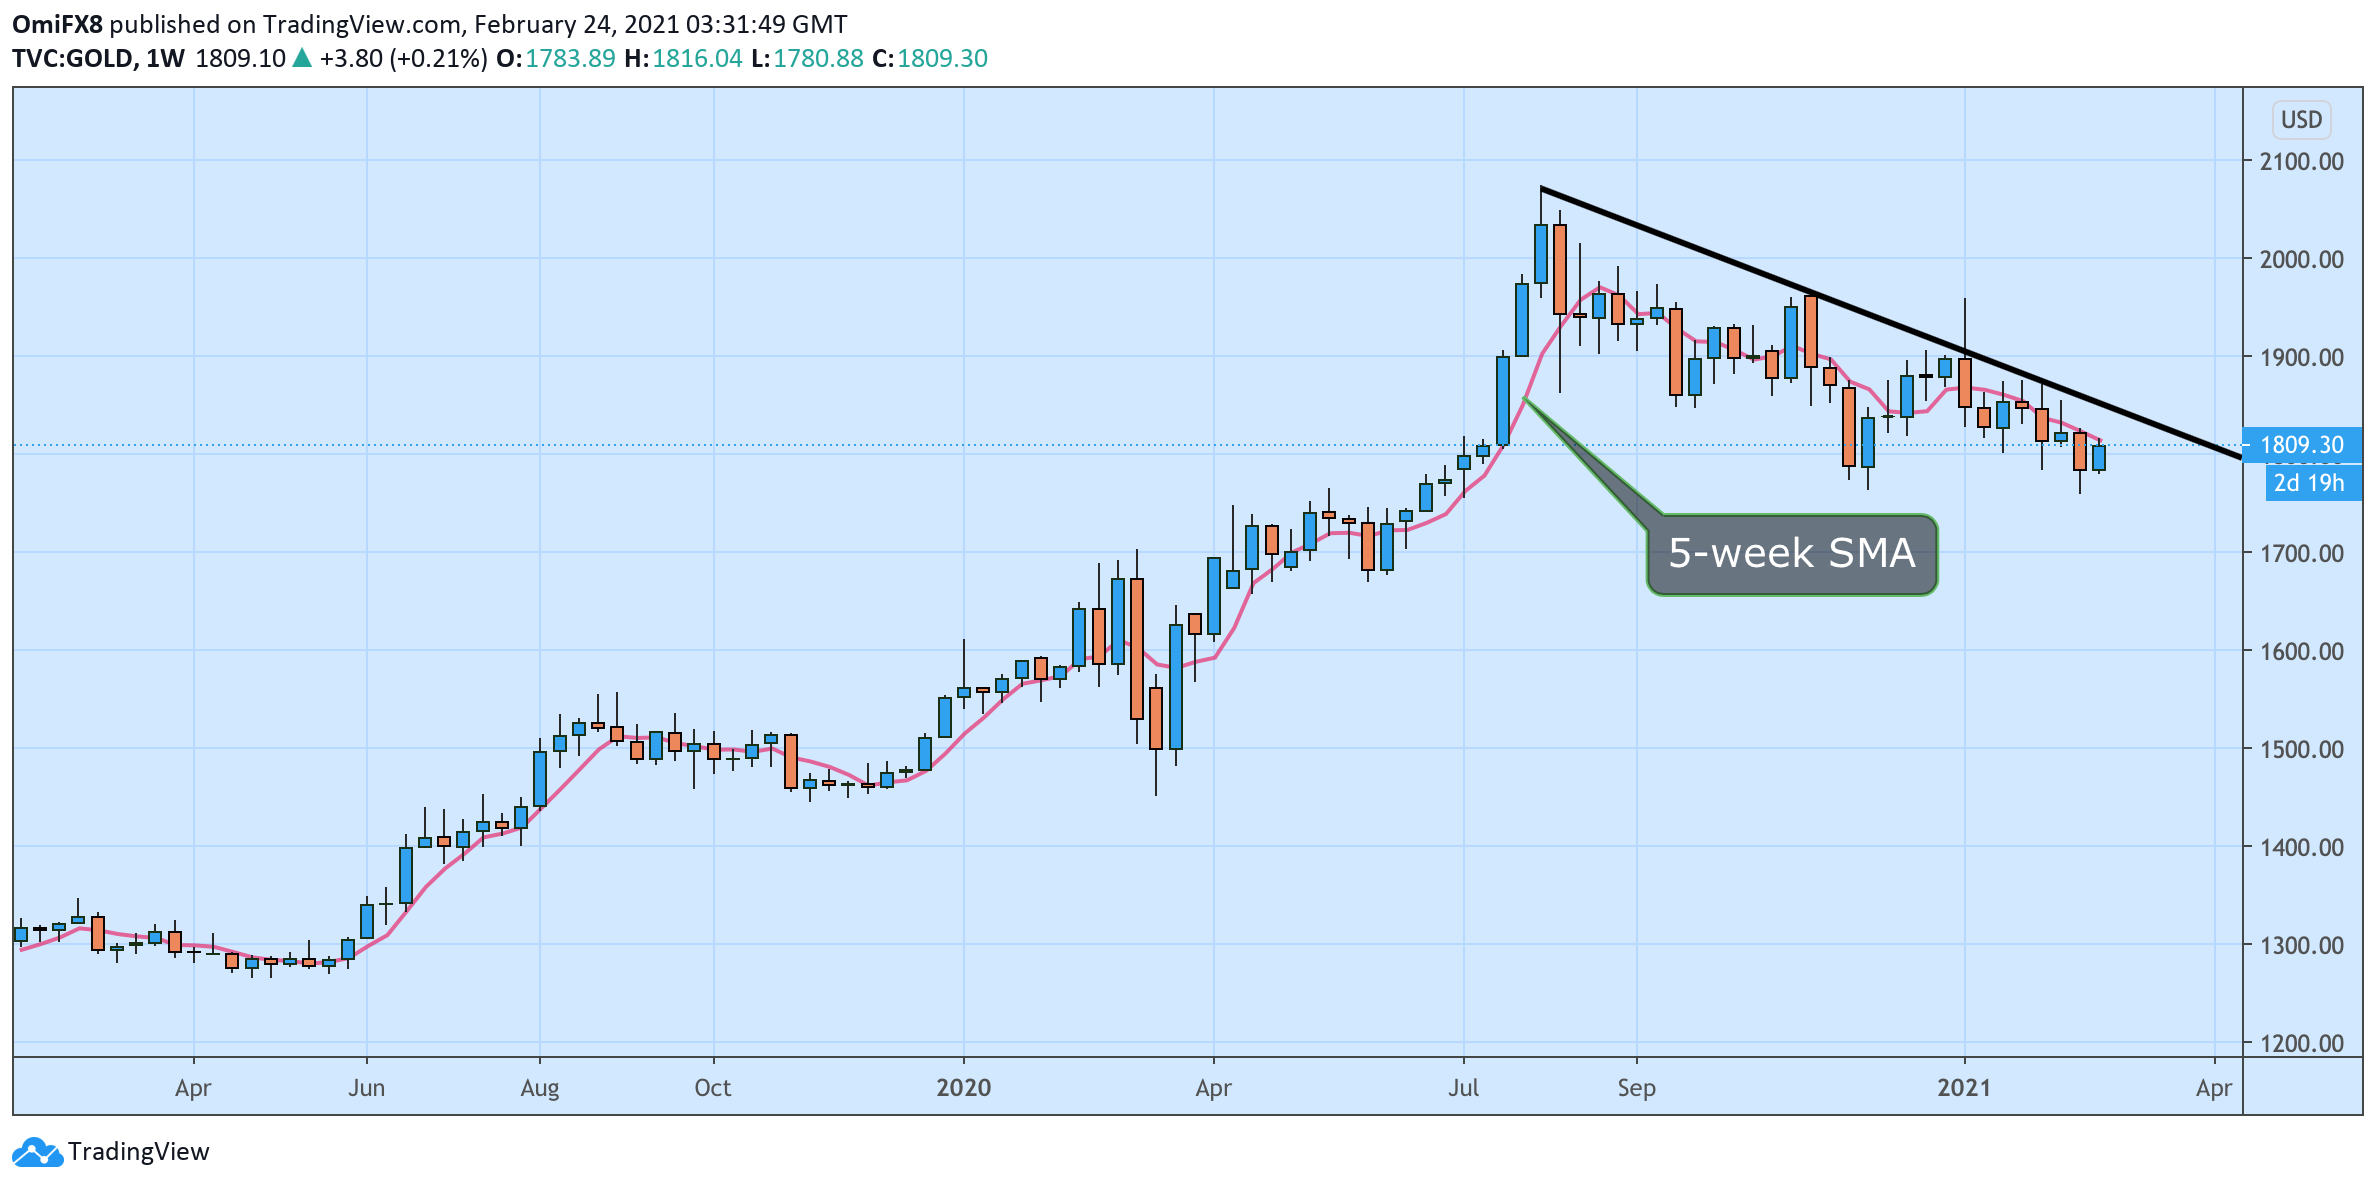
Gold Price Analysis: XAU/USD's upside capped buy 5-week SMA

  • Gold struggles to penetrate the 5-week SMA hurdle. 
  • While gold is up 1% on the week, an 11-month descending trendline is still intact.

Gold trades near $1,810 per ounce at press time, having failed to take out the descending or bearish 5-week Simple Moving Average of $1,816 on Tuesday. 

The sellers failed to establish a foothold under the November low of $1,764 last week, and the metal has risen by more than 1% this week. 

Even so, it's too early to call a bullish reversal, as the descending trendline falling from the record high of $2,075 reached in August is still intact. 

A convincing weekly close above the trendline would imply an end of the pullback from record highs and a resumption of the broader uptrend from the March 2020 low of $1,451.

The bearish bias would strengthen if the metal drops below the weekly low of $1,781.

Weekly chart

Trend: Bearish

Technical levels

XAU/USD

Overview
Today last price1809.6
Today Daily Change4.86
Today Daily Change %0.27
Today daily open1804.74
 
Trends
Daily SMA201818.59
Daily SMA501851.8
Daily SMA1001862.3
Daily SMA2001859.82
 
Levels
Previous Daily High1816.07
Previous Daily Low1795.66
Previous Weekly High1827.11
Previous Weekly Low1760.72
Previous Monthly High1959.42
Previous Monthly Low1802.8
Daily Fibonacci 38.2%1803.46
Daily Fibonacci 61.8%1808.27
Daily Pivot Point S11794.91
Daily Pivot Point S21785.08
Daily Pivot Point S31774.5
Daily Pivot Point R11815.32
Daily Pivot Point R21825.9
Daily Pivot Point R31835.73

Author

Omkar Godbole

Omkar Godbole

FXStreet Contributor

Omkar Godbole, editor and analyst, joined FXStreet after four years as a research analyst at several Indian brokerage companies.

More from Omkar Godbole
Share:

Editor's Picks

AUD/USD eyes 0.7150 barrier nine-day EMA

AUD/USD inches higher after registering modest losses in the previous day, trading around 0.7130 during the Asian hours. The technical analysis of the daily chart indicates that the pair is moving sideways within the rectangle pattern, suggesting a consolidation as neither the bulls nor the bears have enough momentum to take control of the market.

USD/JPY trades below 160.00 intervention threshold; bullish bias intact

The USD/JPY pair attracts some sellers during the Asian session amid fears that authorities will step in again to prop up the Japanese Yen. Furthermore, the Israel-Lebanon truce prompts some profit-taking around the US Dollar and exerts downward pressure on the currency pair.

Gold defends 200-day SMA, rises toward $4,500

Gold is attempting a tepid recovery toward $4,500 on Thursday, as renewed optimism in the Mideast geopolitical front calms market nerves. This cautious optimism across Asian markets weighs on Oil prices, and diminishes the US Dollar’s safe-haven appeal, helping Gold stage a decent comeback from the weekly low of $4,424.


Hyperliquid: ETF demand, capital rotation fuel HYPE rally as Bitcoin melts

Hyperliquid price sustains an upward trend near its all-time high of $75.76 on Thursday after posting 80% gains in May, while Bitcoin (BTC) retraces below $65,000, triggering a market-wide panic.

Kevin Warsh takes the Fed helm: What it means for the US Dollar
The Federal Reserve moves away from the highly predictable "forward guidance" model of the Jerome Powell era to a new “Kevin Warsh environment”, characterized by less communication, more policy surprises, and an increased focus on the Fed's complex balance sheet.
Recession on paper: What really moves the Canadian Loonie now?

Statistics Canada handed the headline writers a gift and the analysts a headache. Real GDP shrank 0.1% on an annualized basis in the first quarter, and with the fourth quarter of 2025 revised down to a 1.0% contraction, that is two negative quarters in a row, the textbook definition of a technical recession and Canada's first since the pandemic.