|

Gold Price Analysis: XAU/USD sellers remain hopeful below $1880 after Trump’s stimulus blow – Confluence Detector

Gold (XAU/USD) is nursing losses after three consecutive days of declines, although remains in a familiar range above $1850. The renewed concerns about a $900 billion COVID-19 relief package could likely keep gold on the back foot. US President Donald Trump asked for an amendment to the pandemic relief package.

However, broad-based US dollar retreat cushions the downside in gold. Brexit deal optimism and disappointing US Consumer Confidence data weigh negatively on the greenback. Pre-Christmas thin trading conditions will continue to play out ahead of the US economic releases.

How is gold positioned on the charts?  

Gold Price Chart: Key resistances and supports

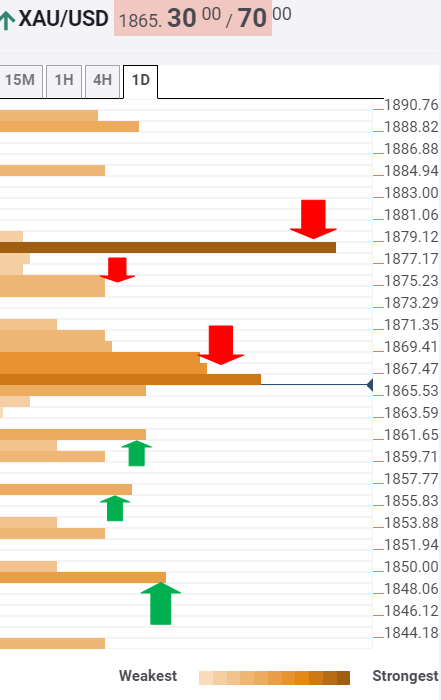
The Technical Confluences Indicator shows that the XAU/USD pair is struggling to overcome a dense cluster of resistance levels stacked up around the $1867-69 region.

That area is the confluence of the Fibonacci 38.2% one-week, SMA5 four-hour and the previous high four-hour.

A firm break above the latter could expose a minor cap at $1874, which is the convergence of the SMA5 one-day and Fibonacci 61.8% one-day.

Up next, the bulls are likely to challenge the critical barrier at $1880, the intersection of the Pivot Point one-day R1, Fibonacci 23.6% one-week and Bollinger Band four-hour Middle.

To the downside, minor support awaits at $1861, where the SMA200 one-hour coincides with SMA50 four-hour and the previous low four-hour.

The SMA10 one-day at $1856 is the next relevant downside target, below which the Pivot Point one-day S1 of $1852 could be probed.

The bears need a break below the $1850 barrier to reviving the bearish bias. The Fibonacci 61.8% one-week is aligned at that level.

Here is how it looks on the tool
fxsoriginal

About Confluence Detector

The TCI (Technical Confluences Indicator) is a tool to locate and point out those price levels where there is a congestion of indicators, moving averages, Fibonacci levels, Pivot Points, etc. Knowing where these congestion points are located is very useful for the trader, and can be used as a basis for different strategies.

Learn more about Technical   Confluence

Author

Dhwani Mehta

Dhwani Mehta

FXStreet

Residing in Mumbai (India), Dhwani is a Senior Analyst and Manager of the Asian session at FXStreet. She has over 10 years of experience in analyzing and covering the global financial markets, with specialization in Forex and commodities markets.


More from Dhwani Mehta
Share:

Editor's Picks

GBP/USD holds range near 1.3500 after UK Q2 GDP

GBP/USD keeps its range near the 1.3500 psychological mark in the European session on Thursday. The mixed UK GDP and industrial data failed to inspire the British Pound. Meanwhile, the US Dollar stabilizes after the US CPI data-led sell-off, checking any upside attempts in the pair.

EUR/USD flatlines above 1.1500 as US Dollar stablizes ahead of PPI

EUR/USD is trading modestly flat above 1.1500 in European trading hours on Thursday. The pair stalls its rebound as the US Dollar consolidates losses incurred after the release of July's Consumer Price Index report. Inflation in the US moderated across a broad range of goods and services, cooling expectations for an aggressive Federal Reserve rate hike in September and weighing on the Greenback. The US PPI data is next in focus.

Gold stays weak below $4,400 as USD stalls post-CPI decline

Gold holds its intraday retracement slide from the highest level since June 5 at the $4,450 area touched earlier this Thursday, and trades below the $4,400 mark in the European session. The initial market reaction to signs of moderating US inflation fades quickly as investors remain worried that higher energy prices will rekindle inflationary pressures, pausing the US Dollar's downside.

XRP holds at make-or-break level, ADA and SOL risk 50-day EMA breakout

Top altcoins, including Ripple, Cardano, and Solana, are facing downside pressure, holding at crucial support levels. The technical outlook for XRP, ADA, and SOL indicates a mild bearish bias as downside pressure mounts.

Boring CPI, boring August?

Yesterday’s unexciting US CPI print left FX with little sense of direction into the end-August Jackson Hole Symposium. What can stop this relentless decline in volatility? Gulf news, Fedspeak and big surprises in tier-two data are all possible candidates. But there’s a good chance they won’t, and EUR/USD may stay in tight ranges for the next few weeks.

Why is Crude Oil priced for a reopening the ships haven't made?
Fourteen vessels crossed the Strait of Hormuz on Tuesday. Before the war, the count ran near 120 a day. In the sessions since the waterway was publicly declared open, Brent has drifted back to $87 and West Texas Intermediate (WTI) to $81, both a little lower again on Wednesday, with daily momentum on each unwound from the top of its range in late July to the low twenties now.