|

Gold Price Analysis: XAU/USD remains vulnerable near multi-day lows, around $1815 region

  • Gold witnessed some follow-through selling for the second consecutive session on Friday.
  • A strong pickup in the USD demand was seen as a key factor weighing on the commodity.
  • The technical set-up supports prospects for a further decline, even below the $1800 mark.

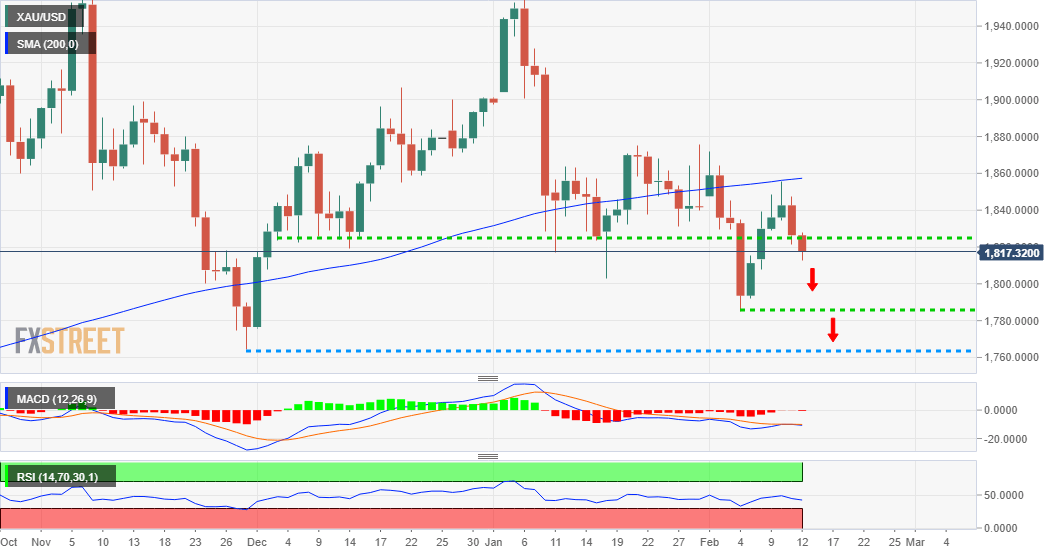
Gold extended this week's rejection slide from the very important 200-day SMA and witnessed some follow-through selling for the second consecutive session on Friday. The commodity remained depressed through the mid-European session and was last seen trading near multi-day lows, around the $1815 region.

Despite doubts about the US economic recovery, the US dollar was back in demand and was seen as one of the key factors exerting some pressure on the dollar-denominated commodity. However, a softer risk tone extended some support to traditional safe-haven assets and helped limit any further losses for the XAU/USD.

From a technical perspective, the overnight sustained breakthrough 200-hour SMA support, around the $1834-33 region, might have already shifted the near-term bias back in favour of bearish traders. A subsequent slide below the $1825 level supports prospects for a further depreciating move towards the $1800 mark.

The bearish outlook is further reinforced by the fact that technical indicators on the daily chart have been struggling to recover from the negative territory. Hence, a subsequent slide towards monthly lows, around the $1785 region, en-route the $1764 zone, levels tested in November 2020, remains a distinct possibility.

On the flip side, the $1825 region now becomes immediate strong resistance. A sustained move beyond might prompt some short-covering move and push the XAU/USD towards the $1842-44 resistance zone. The next relevant hurdle is pegged near the $1854-55 region (200-DMA), which if cleared will negate any near-term bearish bias.

XAU/USD daily chart

fxsoriginal

Technical levels to watch

XAU/USD

Overview
Today last price1816.66
Today Daily Change-9.74
Today Daily Change %-0.53
Today daily open1826.4
 
Trends
Daily SMA201839.82
Daily SMA501859.56
Daily SMA1001869.72
Daily SMA2001856.77
 
Levels
Previous Daily High1847.64
Previous Daily Low1821.22
Previous Weekly High1871.9
Previous Weekly Low1785.02
Previous Monthly High1959.42
Previous Monthly Low1802.8
Daily Fibonacci 38.2%1831.31
Daily Fibonacci 61.8%1837.55
Daily Pivot Point S11815.87
Daily Pivot Point S21805.33
Daily Pivot Point S31789.45
Daily Pivot Point R11842.29
Daily Pivot Point R21858.17
Daily Pivot Point R31868.71

Author

Haresh Menghani

Haresh Menghani is a detail-oriented professional with 10+ years of extensive experience in analysing the global financial markets.

More from Haresh Menghani
Share:

Editor's Picks

EUR/USD eyes nine-day EMA barrier after rebounding from 1.1600

EUR/USD gains ground after registering modest losses in the previous session, trading around 1.1620 during the Asian hours on Friday. The technical analysis of the daily chart suggests an ongoing bearish bias as the pair remains within the descending channel pattern.

GBP/USD: Pound Sterling ticks up against US Dollar in countdown to US NFP

The Pound Sterling trades marginally higher to near 1.3365 against the US Dollar during the Asian trading session on Friday. The GBP/USD pair edges up as the US Dollar ticks down ahead of the United States Nonfarm Payrolls data for February, which will be published at 13:30 GMT.

Gold awaits US Nonfarm Payrolls for a clear directional impetus

Gold rebounds above $5,100 early Friday after testing the $5,050 level amid global sell-off. The US Dollar pulls back as profit-taking creeps in ahead of US labor data. For February. 21-day SMA holds amid bullish RSI; a daily closing above 61.8% Fibo is critical for Gold buyers.

Ethereum pull in $169M as validators pile in to stake ETH

US spot Ethereum exchange-traded funds recorded $169 million in net inflows on Wednesday, marking the largest daily intake in two months, according to SoSoValue data. The rise in inflows signals renewed institutional interest in Ethereum amid broader market volatility.

The market compass is pointing at a barrel of Oil

The Asian open is arriving with equities leaning the wrong way, and the reason is not complicated. The market’s compass needle has snapped firmly toward crude. In this tape, oil is not just another input price; it is the gravitational center around which every asset class is orbiting.

Ripple tests recovery strength amid steady ETF inflows, growing retail interest

Ripple (XRP) continues to demonstrate notable resilience as the cryptocurrency market navigates the persistent war in the Middle East after the United States (US) and Israel attacked Iran on Saturday.