Gold Price Analysis: XAU/USD now up nearly 1%, ETFs amass record inventory


  • Dollar sell-off propels gold to session highs above $1,910.
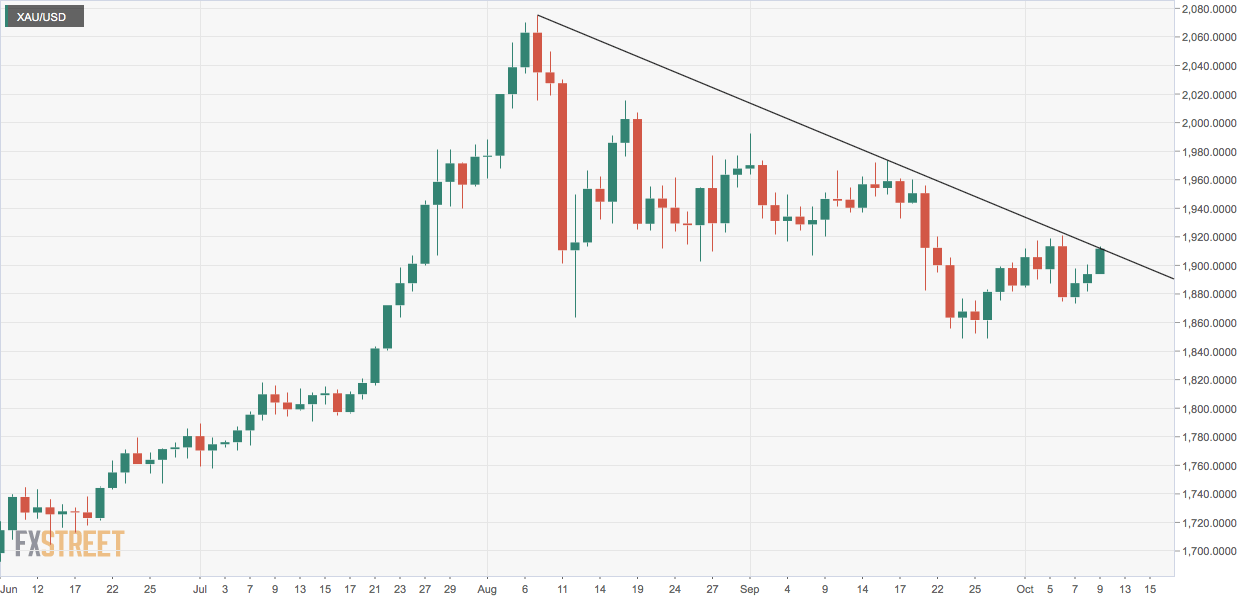
  • Gold is now chipping away at a two-month descending trendline. 
  • ETFs amassed record inventory in the first nine months of 2020.

The upward move in gold is gathering steam with markets offering US dollar alongside continued risk-on action in the global equities. 

The yellow metal is now trading at a session high of $1,912 per ounce, representing a 0.95% gain on the day. 

That level is currently housing the resistance of the trendline falling from the record high of $2,075 reached on Aug. 7.

Acceptance higher would signal a revival of the broader uptrend from lows near $1,450 observed in March and open the doors to a re-test of the record high of $2,075. 

The daily chart MACD histogram has already crossed into bullish territory above zero for the first time since Aug. 10. 

Besides, investor demand has been strong as evidenced by a surge in stockpiles held by the Gold-backed exchange-traded funds (ETFs). 

The ETFS have added more than 1,000 tonnes of bullion in the first nine months of 2020. 

According to Reuters News, the hoarding seen in the first nine months of the year far exceeds any previous full year. 

That said, a breakout in gold may remain elusive if equities drop in the run-up to the Nov. 3 US Presidential Elections, as warned by Goldman Sachs, boosting the haven demand for the US dollar. 

Daily chart

Technical levels

XAU/USD

Overview
Today last price 1912.03
Today Daily Change 18.11
Today Daily Change % 0.95
Today daily open 1893.92
 
Trends
Daily SMA20 1907.57
Daily SMA50 1940.42
Daily SMA100 1860.38
Daily SMA200 1742.37
 
Levels
Previous Daily High 1900.72
Previous Daily Low 1882
Previous Weekly High 1917.16
Previous Weekly Low 1848.82
Previous Monthly High 1992.42
Previous Monthly Low 1848.82
Daily Fibonacci 38.2% 1893.57
Daily Fibonacci 61.8% 1889.15
Daily Pivot Point S1 1883.71
Daily Pivot Point S2 1873.49
Daily Pivot Point S3 1864.99
Daily Pivot Point R1 1902.43
Daily Pivot Point R2 1910.93
Daily Pivot Point R3 1921.15


Share: Feed news

Information on these pages contains forward-looking statements that involve risks and uncertainties. Markets and instruments profiled on this page are for informational purposes only and should not in any way come across as a recommendation to buy or sell in these assets. You should do your own thorough research before making any investment decisions. FXStreet does not in any way guarantee that this information is free from mistakes, errors, or material misstatements. It also does not guarantee that this information is of a timely nature. Investing in Open Markets involves a great deal of risk, including the loss of all or a portion of your investment, as well as emotional distress. All risks, losses and costs associated with investing, including total loss of principal, are your responsibility. The views and opinions expressed in this article are those of the authors and do not necessarily reflect the official policy or position of FXStreet nor its advertisers. The author will not be held responsible for information that is found at the end of links posted on this page.

Recommended content


Recommended content

Editors’ Picks

EUR/USD turns positive above 1.1500, Dollar retreats

EUR/USD turns positive above 1.1500, Dollar retreats

EUR/USD now makes a reversal, up modestly for the day after surpassing the 1.1500 barrier. The pair’s rebound came on the back of increasing and renewed selling pressure around the Greenback, particularly after FOMC Governor M. Bowman opened the door to a July rate cut. Meanwhile, investors remain watchful of the geopolitical landscape ahead of a potential move by Iran in response to the recent US attacks.

Could Iran block the Strait of Hormuz? Why Oil is on edge after US strikes

Could Iran block the Strait of Hormuz? Why Oil is on edge after US strikes

As the Israel-Iran conflict reaches new heights, an old threat is coming back to haunt the markets: that of the closure of the Strait of Hormuz. This narrow arm of the sea in the Persian Gulf, wedged between Iran to the north and the United Arab Emirates and Oman to the south, is much more than a simple sea passage.

Gold treads water below $3,400 on stronger USD

Gold treads water below $3,400 on stronger USD

Gold begins the week on a downward trend, trading below the key $3,400 mark per troy ounce. In the meantime, the precious metal has managed to limit its losses amid the stronger US Dollar (USD) and rising geopolitical tensions in the Middle East.

AI Tokens Price Prediction: Story, Virtuals Protocol rebound following sell-off after US strikes on Iran

AI Tokens Price Prediction: Story, Virtuals Protocol rebound following sell-off after US strikes on Iran

Geopolitical tensions in the Middle East caused a liquidation havoc of over $1 billion in the cryptocurrency market over the weekend, following US President Donald Trump’s direct involvement in the conflict between Israel and Iran.

GBP/USD climbs to daily highs around 1.3480

GBP/USD climbs to daily highs around 1.3480

After bottoming out in multi-week lows near 1.3370, GBP/USD now picks up pace and gains around a cent to hit new daily peaks around 1.3480 in response to fresh selling pressure hitting the Greenback. The knee-jerk in the US Dollar comes despite steady fears on the Iran-Israel-US front and firm results from preliminary US PMIs for the month of June. On the UK docket, all the attention remains on upcoming flash Manufacturing and Services PMIs.

The Best brokers to trade EUR/USD

The Best brokers to trade EUR/USD

SPONSORED Discover the top brokers for trading EUR/USD in 2025. Our list features brokers with competitive spreads, fast execution, and powerful platforms. Whether you're a beginner or an expert, find the right partner to navigate the dynamic Forex market.

Forex MAJORS

Cryptocurrencies

Signatures

Best Brokers of 2025