|

Gold Price Analysis: XAU/USD eyes key $1831 support after benign Fed – Confluence Detector

Gold (XAU/USD) wavers below $1850, consolidating the Fed-led downside, as traders await the US Q4 advance GDP release for a fresh direction.

Gold lost ground once again on Wednesday after the Fed left its key rates unchanged while maintaining the current bond-buying at $120 billion per month. Benign Fed and mounting tensions over the covid surge knocked-of the stocks and boosted the safe-haven demand for the US dollar.

Let’s take a look at the key technical levels for trading gold in the day ahead.

Gold Price Chart: Key resistances and supports

The Technical Confluences Indicator shows that gold is challenging immediate support at $1836, which is the confluence of the previous low one-hour and Fibonacci 23.6% one-day.  

The bears need acceptance below the critical $1831 cushion, where the previous low one-day, Fibonacci 61.8% one-week and pivot point one-day S1.

The next downside target is seen at the Fibonacci 61.8% one-month at $1827. A sharp sell-off below the latter cannot be ruled out, exposing powerful support at $1817, the pivot point one-month S1.

Alternatively, the bulls face a dense cluster of resistance levels around $1842, above which the Fibonacci 61.8% one-day at $1845 guards the upside.

Further up, it is likely to be an uphill task for the XAU bulls until the Fibonacci 38.2% one-month at $1857 is scaled on a sustained basis.

Here is how it looks on the tool
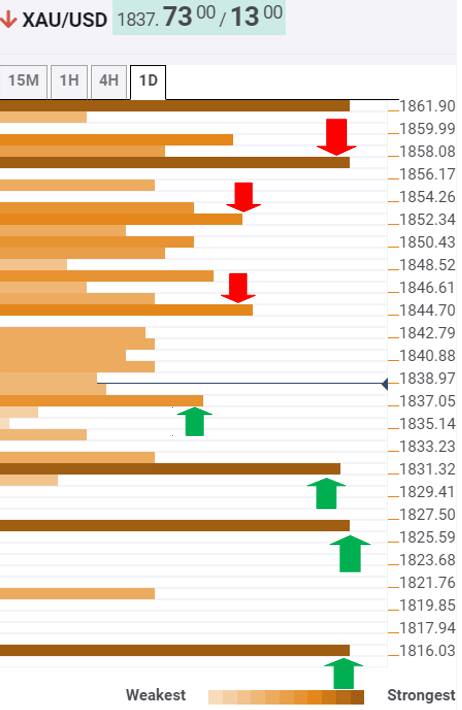
fxsoriginal

About Confluence Detector

The TCI (Technical Confluences Indicator) is a tool to locate and point out those price levels where there is a congestion of indicators, moving averages, Fibonacci levels, Pivot Points, etc. Knowing where these congestion points are located is very useful for the trader, and can be used as a basis for different strategies.

Author

Dhwani Mehta

Dhwani Mehta

FXStreet

Residing in Mumbai (India), Dhwani is a Senior Analyst and Manager of the Asian session at FXStreet. She has over 10 years of experience in analyzing and covering the global financial markets, with specialization in Forex and commodities markets.


More from Dhwani Mehta
Share:

Editor's Picks

GBP/USD flirts with tops near 1.3470

GBP/USD manages to regain composure and challenge the area of daily highs around 1.3470 on Friday. Cable picks up pace despite marginal gains in the Greenback in a context of swelling geopolitical tensions and rising global oil prices.

Gold remains below $4,100 despite receding Fed hike bets, weak USD

Gold opens with a bullish gap at the start of a new week amid receding Fed rate-hike expectations and a bearish US Dollar. Oil prices tumbled after Trump canceled an attack on Iran and said that a deal is near, easing inflation fears. This forces traders to dial back bets on extreme Fed tightening and drags the USD to a fresh low since June 17, which, in turn, is supporting the non-yielding bullion. However, the recent repeated failures to find acceptance above $4,100 warrant caution for XAU/USD bulls.

Gold's struggle with 21-day SMA extends ahead of US-Iran talks

Gold keeps its range around $4,050 early Monday, consolidating the previous decline. The US Dollar holds losses, fuelled by the USD/JPY slump and Mideast diplomacy hopes. Gold awaits a clear directional breakthrough, but sellers likely have the upper hand on the 1D chart.

Week ahead: US payrolls report and AI earnings to keep investors on edge

After the Fed decision, NFP report awaited for more rate hike clues. Employment also on the agenda in Canada and New Zealand. Chinese trade and Japanese wage data to be watched too. But Iran and AI headlines to remain in driver’s seat for risk sentiment.

Bitcoin dips, Ethereum consolidates, XRP stalls

Bitcoin, Ethereum and Ripple steadied on Monday after falling over 2.8%, 3.55% and 2.35%, respectively, the previous week. BTC trades below the key resistance level, ETH consolidates between the 50-day and 100-day Exponential Moving Averages.

9-3: Is the Federal Reserve’s vote tally Warsh's new forward guidance?
The rate did not move. Neither did the statement, and that’s the more interesting fact. Set the July 29 Federal Open Market Committee (FOMC) statement beside the one issued on June 17, and the two documents are identical apart from a single verb and a paragraph at the bottom naming three dissenters.