|

Gold Price Analysis: XAU/USD eyes critical $1862 resistance ahead of Biden’s inauguration – Confluence Detector

Gold (XAU/USD) is advancing above the 200-day SMA, as the US inflation expectations continue to rise, in anticipation of a massive stimulus package under the incoming Biden administration. Stimulus expectations boost gold’s appeal as an inflation-hedge while downing the safe-haven US dollar.

Treasury Secretary nominee Janet Yellen’s backed President-elect Biden’s view for higher fiscal spending, noting that its benefits outweigh the expenses of a higher debt burden. Biden’s inauguration speech is eagerly awaited for fresh hints on the stimulus plan.

How is gold positioned on the technical charts?

Gold Price Chart: Key resistances and supports

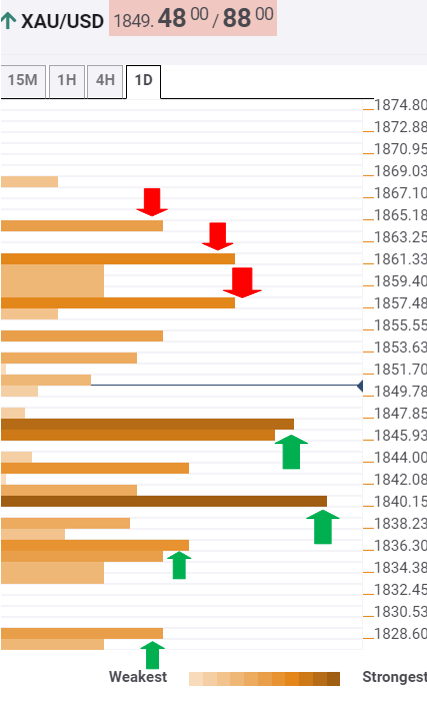
The Technical Confluences Indicator shows that gold has some additional room to the upside, with the immediate resistance seen at $1858. That level is the confluence of the SMA10 one-day and Fibonacci 38.2% one-month.

After crossing a dense cluster of mino9r resistance levels, the XAU bulls may run through strong offers at $1860/62, which is the SMA50 one-day.

The previous week high at $1864 is the level to beat for the gold buyers.

On the flip side, acceptance under the critical support around $1847/46 is needed to invalidate the recovery momentum. The Fibonacci 61.8% one-week intersects with the SMA200 one-day and the previous day high at that point.

The next relevant support awaits at $1840, which is the convergence of the SMA10 four-hour, SMA5 one-day and the previous low four-hour.

The sellers will then target the Fibonacci 38.2% one-week at $1835, below which the $1829 (Fibonacci 23.6% one-week) support will challenge the bears’ commitment.

Here is how it looks on the tool

fxsoriginal

About Confluence Detector

The TCI (Technical Confluences Indicator) is a tool to locate and point out those price levels where there is a congestion of indicators, moving averages, Fibonacci levels, Pivot Points, etc. Knowing where these congestion points are located is very useful for the trader, and can be used as a basis for different strategies.

Author

Dhwani Mehta

Dhwani Mehta

FXStreet

Residing in Mumbai (India), Dhwani is a Senior Analyst and Manager of the Asian session at FXStreet. She has over 10 years of experience in analyzing and covering the global financial markets, with specialization in Forex and commodities markets.

More from Dhwani Mehta
Share:

Editor's Picks

AUD/USD stalls rebound above 0.7050 amid fresh Mideast tensions

AUD/USD stalls its rebound from almost two-month lows and treads water near 0.7050 in Asia on Monday, as the US Dollar pauses following Friday's upbeat US NFP-led blowout rally to a two-month high. However, renewed geopolitical tensions, along with surging bets on Fed rate hikes, continue to act as a tailwind for the USD, capping the higher-yielding Aussie.

USD/JPY holds higher ground toward 160.50 despite 'Yentervention' fears

USD/JPY holds higher ground toward 160.50 in Monday's Asian trading, despite intervention fears. Japan’s revised GDP print, which confirmed that the economy lost momentum in the first quarter, weighs on the Japanese Yen. Meanwhile, Friday's upbeat US NFP report and fresh Israel-Iran attacks favor the US Dollar bulls, underpinning the currency pair.

Gold stays vulnerable near $4,300 on Mideast woes, Fed rate hike bets

Gold remains vulnerable near $4,300 in early Europe on Monday, following a modest Asian bounce to the $4,350-$4,355 area. Renewed hostilities in the Gulf push Crude Oil prices higher, fanning inflationary concerns and bolstering bets for more hawkish central banks. That weighs negatively on the Gold, as it mires in three-month lows.

Dogecoin: Smart money flees DOGE, exposing a 12% downside risk

Dogecoin price hovers around $0.0850 at press time on Monday, keeping steady after a 5% rebound the previous day from the February 6 low at $0.08000. On-chain data show that large-wallet investors with 100 million to 1 billion DOGE have reduced their holdings to a five-month low, providing the downside pressure.

Week ahead – Fed countdown begins amid US inflation data and geopolitical risks

Fed Chair Warsh’s first meeting approaches as key US inflation data could reshape expectations. Oil prices remain elevated as US-Iran talks continue; tariffs also return to the spotlight. ECB is expected to hike; will it be a one-off move or is July live?

The US economy defies the rules: 100 days into the Oil shock and the recession signal is still missing

More than three months after the start of the Iran war and the resulting disruption to global energy markets, the US economy continues to display remarkable resilience. The conflict has triggered a sharp rise in Oil prices, reignited inflationary pressures and fueled widespread concerns about a potential economic slowdown.