Gold Price Analysis: XAU/USD eyes $1876 but needs acceptance above critical $1863 cap – Confluence Detector

Gold (XAU/USD) is consolidating Tuesday’s rebound above $1850, gathering pace for the next leg higher. The US dollar’s decline alongside the Treasury yields is keeping the XAU buyers hopeful amid expectations of a multitrillion-dollar stimulus likely to be announced by President-elect Joe Biden on Thursday.
Investors rethink about the recent rally in Treasury yields against the Fed’s tapering talks and growing covid cases. Focus shifts to the US CPI report due later on Wednesday for fresh cues.
How is gold positioned on the charts?
Gold Price Chart: Key resistances and supports
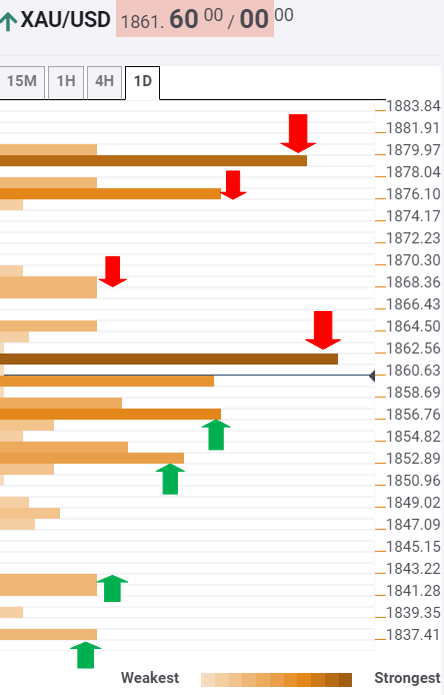
The Technical Confluences Indicator shows that gold continues to face strong offers around $1863, the convergence of the SMA200 four-hour, SMA5 15-minutes and Bollinger Band four-hour Middle.
A sustained break above that level is needed to take on the next barrier aligned at $1869, which is the confluence of the pivot point one-day R1 and SMA50 one-day.
Further north, the Fibonacci 23.6 one-month at $1876 could cap the advances. However, powerful resistance at $1879 will be a tough nut to crack for the XAU bulls.
Alternatively, immediate support awaits at $$1856, the Fibonacci 38.2% one-month, below which $1853 could be challenged. That level is the intersection of the previous low on four-hour, SMA10 one-hour and Bollinger Band 15-minutes Lower.
Sellers would then target the critical cushion at $1842, where the SMA200 one-day coincides with the pivot point one-day S1.
The last line of defense for the buyers is seen at the previous day low of $1837.
Here is how it looks on the tool
About Confluence Detector
The TCI (Technical Confluences Indicator) is a tool to locate and point out those price levels where there is a congestion of indicators, moving averages, Fibonacci levels, Pivot Points, etc. Knowing where these congestion points are located is very useful for the trader, and can be used as a basis for different strategies.
Author

Dhwani Mehta
FXStreet
Residing in Mumbai (India), Dhwani is a Senior Analyst and Manager of the Asian session at FXStreet. She has over 10 years of experience in analyzing and covering the global financial markets, with specialization in Forex and commodities markets.


