Gold Price Analysis: XAU/USD eyes $1755 as the next upside target – Confluence Detector


Gold (XAU/USD) is consolidating its solid recovery from multi-month troughs on Wednesday, as the upbeat market mood weighs on the traditional safe-haven. The vaccine optimism seems to have helped the risk-recovery, especially after US President announced the US will have enough vaccine supply significantly sooner, which will cover all adults by the end of May.

Gold staged a $30 rebound on Tuesday from $1707 after the retreat in the US Treasury yields calmed the markets and diminished the haven demand for the US dollar. Gold traders now await the critical US ADP jobs and ISM Services PMI data while keeping a close eye on the US $.9 trillion stimulus bill.

How is gold positioned on the technical charts?

Gold Price Chart: Key resistance and support levels

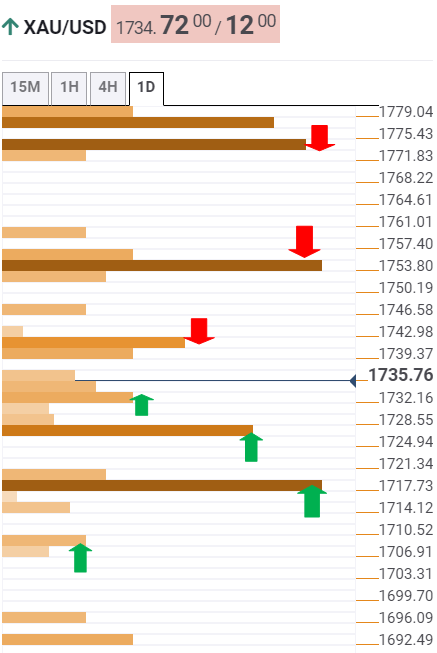
The Technical Confluences Detector shows that gold is battling a major resistance at $1739/40, which is the convergence of the previous high four-hour, Fibonacci 23.6% one-week and the previous day high.

The next upside target is placed at $1755, where the Fibonacci 23.6% one-month lies.

Acceptance above the latter could trigger a sharp rally towards the $1773 zone, where the SMA10 one-day, SMA100 one-hour and SMA50 four-hour coincide.

To the downside, immediate cushion awaits at $1730, the intersection of the Fibonacci 23.6% one-day, previous low one-hour and Bollinger Band one-hour Middle.

The sellers will then challenge significant support at $1726, the Fibonacci 38.2% one-day.

Further south, the bears need to crack $1717 to resume the downtrend. That level is the confluence of the previous month and week lows.

The previous day low at $1707 would be back in play, subsequently.

Here is how it looks on the tool

fxsoriginal

About Technical Confluences Detector

The TCD (Technical Confluences Detector) is a tool to locate and point out those price levels where there is a congestion of indicators, moving averages, Fibonacci levels, Pivot Points, etc. Knowing where these congestion points are located is very useful for the trader, and can be used as a basis for different strategies.


Share: Feed news

Information on these pages contains forward-looking statements that involve risks and uncertainties. Markets and instruments profiled on this page are for informational purposes only and should not in any way come across as a recommendation to buy or sell in these assets. You should do your own thorough research before making any investment decisions. FXStreet does not in any way guarantee that this information is free from mistakes, errors, or material misstatements. It also does not guarantee that this information is of a timely nature. Investing in Open Markets involves a great deal of risk, including the loss of all or a portion of your investment, as well as emotional distress. All risks, losses and costs associated with investing, including total loss of principal, are your responsibility. The views and opinions expressed in this article are those of the authors and do not necessarily reflect the official policy or position of FXStreet nor its advertisers. The author will not be held responsible for information that is found at the end of links posted on this page.

If not otherwise explicitly mentioned in the body of the article, at the time of writing, the author has no position in any stock mentioned in this article and no business relationship with any company mentioned. The author has not received compensation for writing this article, other than from FXStreet.

FXStreet and the author do not provide personalized recommendations. The author makes no representations as to the accuracy, completeness, or suitability of this information. FXStreet and the author will not be liable for any errors, omissions or any losses, injuries or damages arising from this information and its display or use. Errors and omissions excepted.

The author and FXStreet are not registered investment advisors and nothing in this article is intended to be investment advice.

Recommended content


Recommended content

Editors’ Picks

AUD/USD risks a deeper drop in the short term

AUD/USD risks a deeper drop in the short term

AUD/USD rapidly left behind Wednesday’s decent advance and resumed its downward trend on the back of the intense buying pressure in the greenback, while mixed results from the domestic labour market report failed to lend support to AUD.

AUD/USD News

EUR/USD leaves the door open to a decline to 1.0600

EUR/USD leaves the door open to a decline to 1.0600

A decent comeback in the Greenback lured sellers back into the market, motivating EUR/USD to give away the earlier advance to weekly tops around 1.0690 and shift its attention to a potential revisit of the 1.0600 neighbourhood instead.

EUR/USD News

Gold is closely monitoring geopolitics

Gold is closely monitoring geopolitics

Gold trades in positive territory above $2,380 on Thursday. Although the benchmark 10-year US Treasury bond yield holds steady following upbeat US data, XAU/USD continues to stretch higher on growing fears over a deepening conflict in the Middle East.

Gold News

Bitcoin price shows strength as IMF attests to spread and intensity of BTC transactions ahead of halving

Bitcoin price shows strength as IMF attests to spread and intensity of BTC transactions ahead of halving

Bitcoin (BTC) price is borderline strong and weak with the brunt of the weakness being felt by altcoins. Regarding strength, it continues to close above the $60,000 threshold for seven weeks in a row.

Read more

Is the Biden administration trying to destroy the Dollar?

Is the Biden administration trying to destroy the Dollar?

Confidence in Western financial markets has already been shaken enough by the 20% devaluation of the dollar over the last few years. But now the European Commission wants to hand Ukraine $300 billion seized from Russia.

Read more

Forex MAJORS

Cryptocurrencies

Signatures