Gold Price Analysis: XAU/USD consolidates the break above 50-HMA, focus on yields


  • Gold bulls take a breather before resuming the upside momentum.
  • Retreating Treasury yields, risk-on mood weigh on DXY, underpin gold.
  • The hourly technical setup suggests a fresh leg higher could be in the offing.

Gold (XAU/USD) is consolidating the advance to $1745 levels, as the bulls catch a breath before resuming their journey towards the two-week highs of $1756.

The latest leg higher in gold was driven by the retreat in the US Treasury yields across the curve, which somewhat eased overheating fears and lifted the market mood. The safe-haven US dollar took a hit, in turn, offering support to the bright metal.

At the time of writing, the benchmark US 10-year rates are down nearly 2.50% on the day, below the 1.70% level. The yields hit the highest levels since January 2020 at 1.74% on Thursday.  

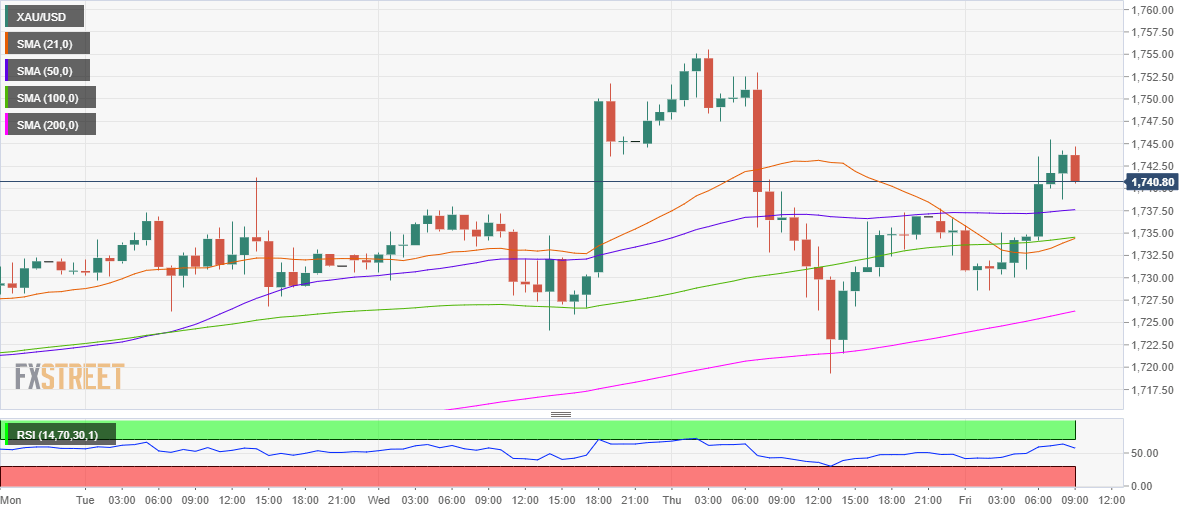
Meanwhile, the short-term technical setup for gold remains constructive, especially after the buyers found acceptance above the critical 50-hourly moving average (HMA) at $1738.

Therefore, the XAU bulls could find some support on any pullback from higher levels. A breach of the last could expose the powerful support at $1734.50, where the 21 and 100-HMAs intersect.

However, with the Relative Strength Index (RSI) still holding firmer above the midline, the upside bias remains intact.

Adding credence to the upbeat outlook, the intersection of the 21 and 100-HMAs has confirmed a bull crossover.

The next relevant target to the upside is seen at $1750, the psychological level, above which the two-week highs could be retested.

The March high at $1760 continues to remain on the buyers’ radars.

Gold Price Chart: Hourly

Gold: Additional levels

XAU/USD

Overview
Today last price 1741.32
Today Daily Change 4.45
Today Daily Change % 0.26
Today daily open 1736.87
 
Trends
Daily SMA20 1738.81
Daily SMA50 1796.04
Daily SMA100 1832.8
Daily SMA200 1860.47
 
Levels
Previous Daily High 1755.59
Previous Daily Low 1719.3
Previous Weekly High 1739.93
Previous Weekly Low 1676.87
Previous Monthly High 1871.9
Previous Monthly Low 1717.24
Daily Fibonacci 38.2% 1733.16
Daily Fibonacci 61.8% 1741.73
Daily Pivot Point S1 1718.92
Daily Pivot Point S2 1700.96
Daily Pivot Point S3 1682.63
Daily Pivot Point R1 1755.21
Daily Pivot Point R2 1773.54
Daily Pivot Point R3 1791.5


Share: Feed news

Information on these pages contains forward-looking statements that involve risks and uncertainties. Markets and instruments profiled on this page are for informational purposes only and should not in any way come across as a recommendation to buy or sell in these assets. You should do your own thorough research before making any investment decisions. FXStreet does not in any way guarantee that this information is free from mistakes, errors, or material misstatements. It also does not guarantee that this information is of a timely nature. Investing in Open Markets involves a great deal of risk, including the loss of all or a portion of your investment, as well as emotional distress. All risks, losses and costs associated with investing, including total loss of principal, are your responsibility. The views and opinions expressed in this article are those of the authors and do not necessarily reflect the official policy or position of FXStreet nor its advertisers. The author will not be held responsible for information that is found at the end of links posted on this page.

If not otherwise explicitly mentioned in the body of the article, at the time of writing, the author has no position in any stock mentioned in this article and no business relationship with any company mentioned. The author has not received compensation for writing this article, other than from FXStreet.

FXStreet and the author do not provide personalized recommendations. The author makes no representations as to the accuracy, completeness, or suitability of this information. FXStreet and the author will not be liable for any errors, omissions or any losses, injuries or damages arising from this information and its display or use. Errors and omissions excepted.

The author and FXStreet are not registered investment advisors and nothing in this article is intended to be investment advice.

Recommended content


Recommended content

Editors’ Picks

EUR/USD clings to daily gains above 1.0650

EUR/USD clings to daily gains above 1.0650

EUR/USD gained traction and turned positive on the day above 1.0650. The improvement seen in risk mood following the earlier flight to safety weighs on the US Dollar ahead of the weekend and helps the pair push higher.

EUR/USD News

GBP/USD recovers toward 1.2450 after UK Retail Sales data

GBP/USD recovers toward 1.2450 after UK Retail Sales data

GBP/USD reversed its direction and advanced to the 1.2450 area after touching a fresh multi-month low below 1.2400 in the Asian session. The positive shift seen in risk mood on easing fears over a deepening Iran-Israel conflict supports the pair.

GBP/USD News

Gold holds steady at around $2,380 following earlier spike

Gold holds steady at around $2,380 following earlier spike

Gold stabilized near $2,380 after spiking above $2,400 with the immediate reaction to reports of Israel striking Iran. Meanwhile, the pullback seen in the US Treasury bond yields helps XAU/USD hold its ground.

Gold News

Bitcoin Weekly Forecast: BTC post-halving rally could be partially priced in Premium

Bitcoin Weekly Forecast: BTC post-halving rally could be partially priced in

Bitcoin price shows no signs of directional bias while it holds above  $60,000. The fourth BTC halving is partially priced in, according to Deutsche Bank’s research. 

Read more

Week ahead – US GDP and BoJ decision on top of next week’s agenda

Week ahead – US GDP and BoJ decision on top of next week’s agenda

US GDP, core PCE and PMIs the next tests for the Dollar. Investors await BoJ for guidance about next rate hike. EU and UK PMIs, as well as Australian CPIs also on tap.

Read more

Forex MAJORS

Cryptocurrencies

Signatures