Gold Price Analysis: XAU/USD clings to recovery gains above $1780 as Treasury yields ease
- Gold’s 1H chart spots falling wedge breakout, backing the bounce.
- Retreating Treasury yields save the day for the XAU bulls.
- RSI trades flat around the midline while 21-HMA offers support.

Gold (XAU/USD) is holding onto the overnight recovery gains in early European trading, showing some signs of life amid a retreat in the US Treasury yields across the curve.
In the session ahead, the rebound in gold could regain traction, as suggested by the near-term technical outlook.
Gold Price Chart: Hourly chart
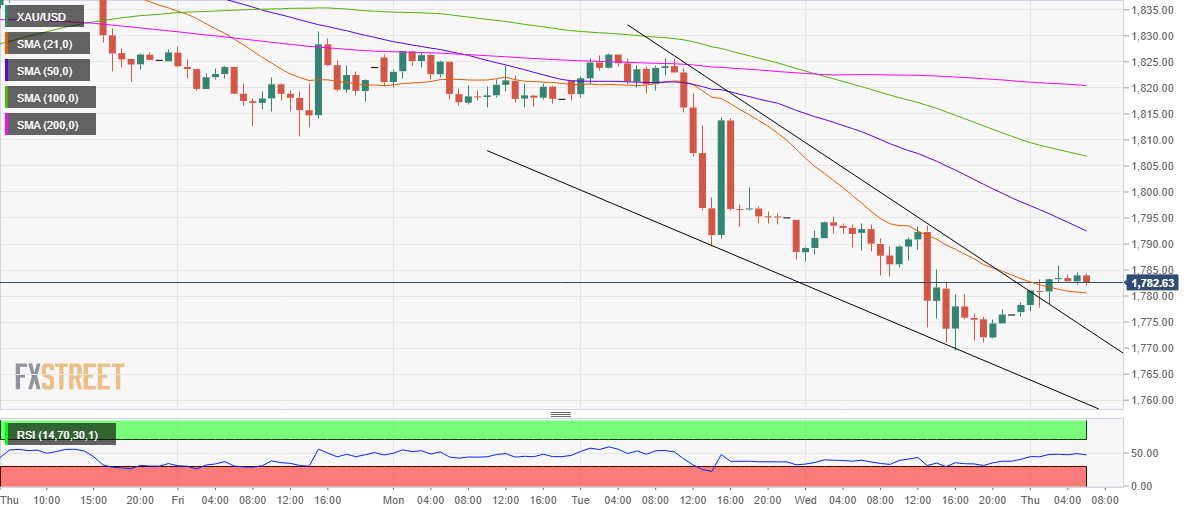
The spot has charted a falling wedge breakout on the hourly sticks, following which it recaptured the 21-hourly moving average (HMA) at $1780.
The hourly relative strength index (RSI) trades flattish around the midline, offering no clear directional bias, at the moment.
To the upside, the bearish 50-HMA at $1793 could challenge the buyers’ commitments. Further up, the January low of $1803 could be tested.
Alternatively, a breach of the 21-HMA, the pattern resistance now support at $1773 could guard the downside.
Meanwhile, Wednesday’s low at $1770 could be eyed ahead of the November 30 low of $1765.
Gold: Additional levels
The spot has charted a falling wedge breakout on the hourly sticks, following which it recaptured the 21-hourly moving average (HMA) at $1780.
The hourly relative strength index (RSI) trades flattish around the midline, offering no clear directional bias, at the moment.
To the upside, the bearish 50-HMA at $1793 could challenge the buyers’ commitments. Further up, the January low of $1803 could be tested.
Alternatively, a breach of the 21-HMA, the pattern resistance now support at $1773 could guard the downside.
Meanwhile, Wednesday’s low at $1770 could be eyed ahead of the November 30 low of $1765.
Author

Dhwani Mehta
FXStreet
Residing in Mumbai (India), Dhwani is a Senior Analyst and Manager of the Asian session at FXStreet. She has over 10 years of experience in analyzing and covering the global financial markets, with specialization in Forex and commodities markets.


