Gold Price Analysis: XAU/USD challenges 100-SMA support again ahead of US data


  • Gold is back in the red amid resurgent US dollar demand across the board.
  • XAU/USD retests ascending 100-SMA on the 4H chart amid bearish RSI.  
  • Downside appears more compelling ahead of the US macro news.

Gold (XAU/USD) has returned to the red zone in the European session, having attempted a tepid bounce earlier in the Asian trading.

The US dollar resumes a recent uptrend and hits fresh two-week highs against its six major peers, despite the risk-on action in the European indices and positive US stock futures.

The uptick in the US Treasury yields also exerts additional downside pressure on the yieldless gold, as traders await fresh cues from the US ADP and ISM Services PMI reports for the next direction.

Gold: Technical outlook

Having faced rejection near $1784 earlier in the day, gold sellers fought back control and knocked off the rates below strong support at $1778.

At that level, the 21-simple moving average (SMA) coincides with the 50-SMA.

Gold Price Chart: Four-hour  

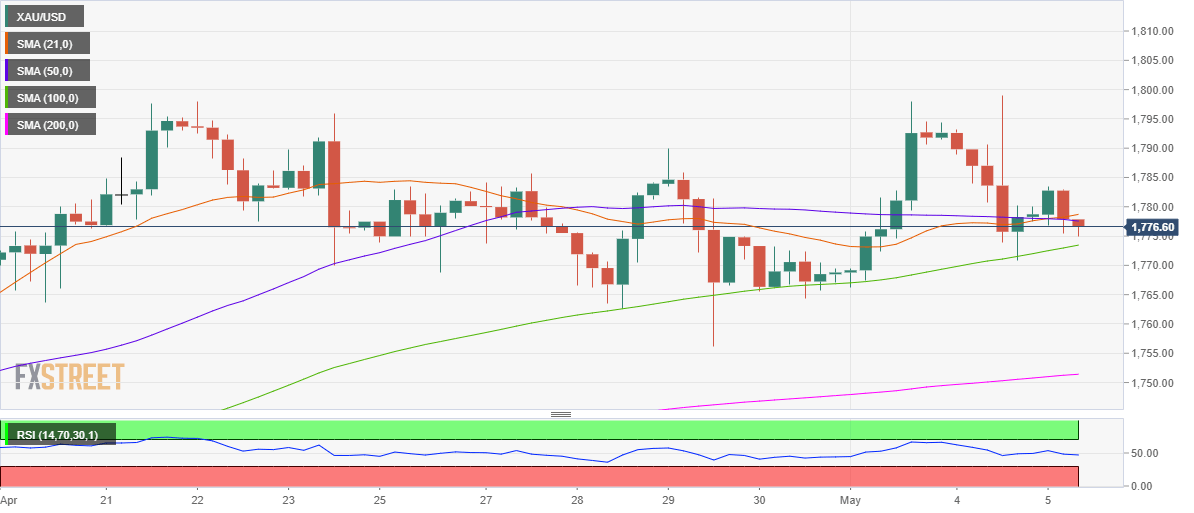
Subsequently, the bears tested the 100-SMA support at $1773 once again. A four-hourly closing below the latter is likely to expose Tuesday’s low of $1770.

April 29 low at $1765 will be the next cap, cushioning the downside.

The Relative Strength Index (RSI) edges lower below the midline, allowing more room for losses.

Alternatively, the buyers need to recapture the $1778 support-turned-resistance, in order to revive the bullish momentum towards the $1800 mark.

Ahead of that crucial round figure, the previous week high of $1790 could test the bullish commitments.

Gold: Additional levels

XAU/USD

Overview
Today last price 1775.3
Today Daily Change -3.70
Today Daily Change % -0.21
Today daily open 1779
 
Trends
Daily SMA20 1767.38
Daily SMA50 1744.91
Daily SMA100 1798.85
Daily SMA200 1853.98
 
Levels
Previous Daily High 1799.08
Previous Daily Low 1770.9
Previous Weekly High 1790.03
Previous Weekly Low 1756.18
Previous Monthly High 1797.93
Previous Monthly Low 1705.84
Daily Fibonacci 38.2% 1781.66
Daily Fibonacci 61.8% 1788.32
Daily Pivot Point S1 1766.91
Daily Pivot Point S2 1754.81
Daily Pivot Point S3 1738.73
Daily Pivot Point R1 1795.09
Daily Pivot Point R2 1811.17
Daily Pivot Point R3 1823.27


Share: Feed news

Information on these pages contains forward-looking statements that involve risks and uncertainties. Markets and instruments profiled on this page are for informational purposes only and should not in any way come across as a recommendation to buy or sell in these assets. You should do your own thorough research before making any investment decisions. FXStreet does not in any way guarantee that this information is free from mistakes, errors, or material misstatements. It also does not guarantee that this information is of a timely nature. Investing in Open Markets involves a great deal of risk, including the loss of all or a portion of your investment, as well as emotional distress. All risks, losses and costs associated with investing, including total loss of principal, are your responsibility. The views and opinions expressed in this article are those of the authors and do not necessarily reflect the official policy or position of FXStreet nor its advertisers. The author will not be held responsible for information that is found at the end of links posted on this page.

If not otherwise explicitly mentioned in the body of the article, at the time of writing, the author has no position in any stock mentioned in this article and no business relationship with any company mentioned. The author has not received compensation for writing this article, other than from FXStreet.

FXStreet and the author do not provide personalized recommendations. The author makes no representations as to the accuracy, completeness, or suitability of this information. FXStreet and the author will not be liable for any errors, omissions or any losses, injuries or damages arising from this information and its display or use. Errors and omissions excepted.

The author and FXStreet are not registered investment advisors and nothing in this article is intended to be investment advice.

Recommended content


Recommended content

Editors’ Picks

AUD/USD favours extra retracements in the short term

AUD/USD favours extra retracements in the short term

AUD/USD kept the negative stance well in place and briefly broke below the key 0.6400 support to clinch a new low for the year on the back of the strong dollar and mixed results from the Chinese docket.

AUD/USD News

EUR/USD now shifts its attention to 1.0500

EUR/USD now shifts its attention to 1.0500

The ongoing upward momentum of the Greenback prompted EUR/USD to lose more ground, hitting new lows for 2024 around 1.0600, driven by the significant divergence in monetary policy between the Fed and the ECB.

EUR/USD News

Gold aiming to re-conquer the $2,400 level

Gold aiming to re-conquer the $2,400 level

Gold stages a correction on Tuesday and fluctuates in negative territory near $2,370 following Monday's upsurge. The benchmark 10-year US Treasury bond yield continues to push higher above 4.6% and makes it difficult for XAU/USD to gain traction.

Gold News

Bitcoin price defends $60K as whales hold onto their BTC despite market dip

Bitcoin price defends $60K as whales hold onto their BTC despite market dip

Bitcoin (BTC) price still has traders and investors at the edge of their seats as it slides further away from its all-time high (ATH) of $73,777. Some call it a shakeout meant to dispel the weak hands, while others see it as a buying opportunity.

Read more

Friday's Silver selloff may have actually been great news for silver bulls!

Friday's Silver selloff may have actually been great news for silver bulls!

Silver endured a significant selloff last Friday. Was this another step forward in the bull market? This may seem counterintuitive, but GoldMoney founder James Turk thinks it was a positive sign for silver bulls.

Read more

Forex MAJORS

Cryptocurrencies

Signatures