Gold Price Analysis: XAU/USD bulls losing conviction below key $1761 hurdle– Confluence Detector

Gold (XAU/USD) is retreating from five-week highs, as the US dollar finds its feet amid a downbeat market mood. Growing concerns over the covid surge and vaccine side-effects dent the risk sentiment, lifting the haven demand for the greenback. Stronger US jobs data also continue to buoy the dollar.
Meanwhile, the US Treasury yields are stabilizing after a dovish blow from the FOMC minutes and Fed Chair Powell’s comments. Looking ahead the dynamics in the yields and dollar will continue to have a significant influence on gold prices.
Let’s take a look at how gold is positioned on the technical graphs.
Gold Price Chart: Key resistance and support levels
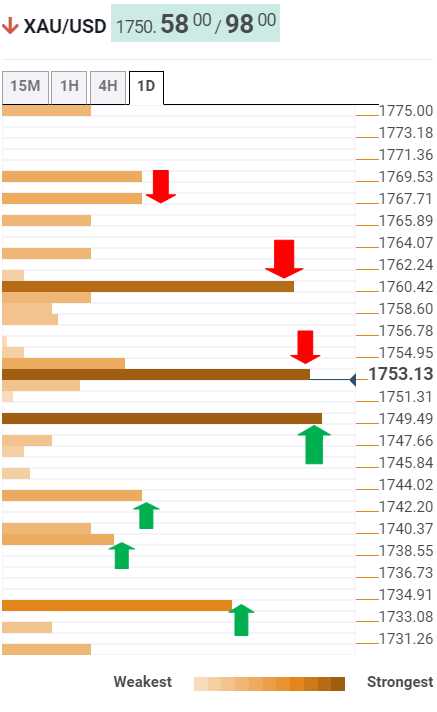
The Technical Confluences Detector shows that gold is extending its retreat after facing rejection at the critical resistance at $1761, the confluence of the previous day high, Bollinger Band one-day Upper and the previous month high.
The XAU sellers then found acceptance below the $1754 support now resistance, where the SMA5 four-hour coincides with the Fibonacci 23.6% one-day.
The next relevant support awaits at $1750; the intersection of the Fibonacci 38.2% one-day and pivot point one-week R1.
Further down, the Fibonacci 61.8% one-day at $1743 could protect the XAU buyers, below which the pivot point one-day S1 and SMA5 one-day around $1739 will get tested.
The convergence of the previous day low and the previous week high at $1735 could challenge the bearish commitments.
Alternatively, the bulls need acceptance above the $1761 barrier to unleash further upside towards the Fibonacci 161.8% one-week at $1767.
Here is how it looks on the tool
About Technical Confluences Detector
The TCD (Technical Confluences Detector) is a tool to locate and point out those price levels where there is a congestion of indicators, moving averages, Fibonacci levels, Pivot Points, etc. Knowing where these congestion points are located is very useful for the trader, and can be used as a basis for different strategies.
Author

Dhwani Mehta
FXStreet
Residing in Mumbai (India), Dhwani is a Senior Analyst and Manager of the Asian session at FXStreet. She has over 10 years of experience in analyzing and covering the global financial markets, with specialization in Forex and commodities markets.