|
Gold Price Analysis: XAU/USD bulls eyeing $1570.00/oz and above
- XAU/USD remains well supported above the 1560.00 mark.
- The level to beat for bulls is the 1572.39 resistance.

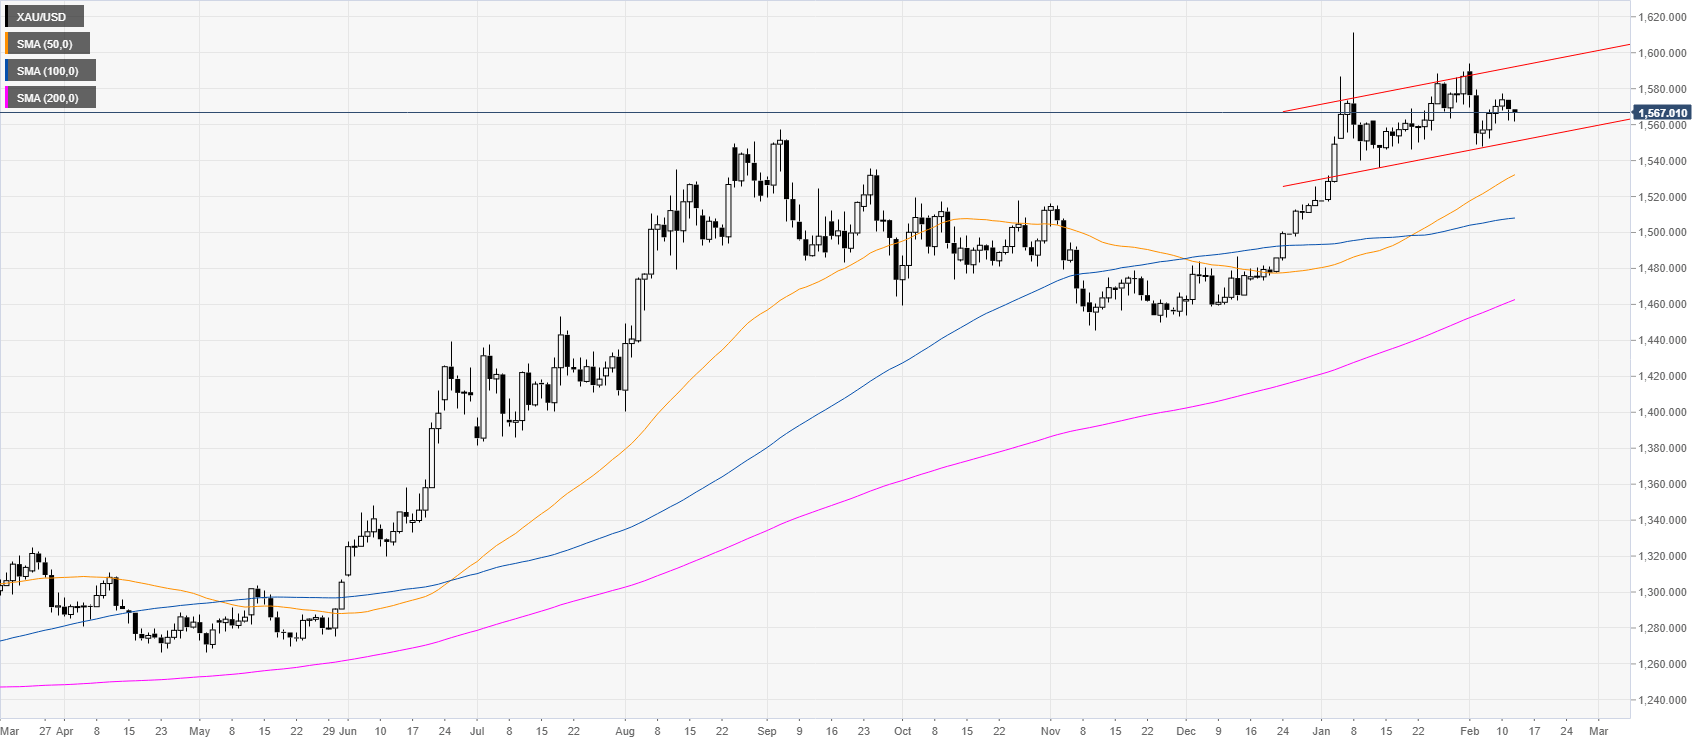
Gold daily chart
Gold is trading in a bull trend above the main daily simple moving averages (SMAs). The market is evolving in a rising channel while the price appears to be supported above the 1560.00 figure.
Gold four-hour chart
XAU/USD is trading above the 200 SMA while challenging the 50/100 SMAs on the four-hour chart. Bulls appear to be in control and a break above the 1567.50 resistance is likely to lead to gains towards the 1572.39, 1575.65 and 1580.00 price levels. Retracements down could find support near the 1562.62, 1557.73, 1553.00 and 1547.95 levels, according to the Technical Confluences Indicator.
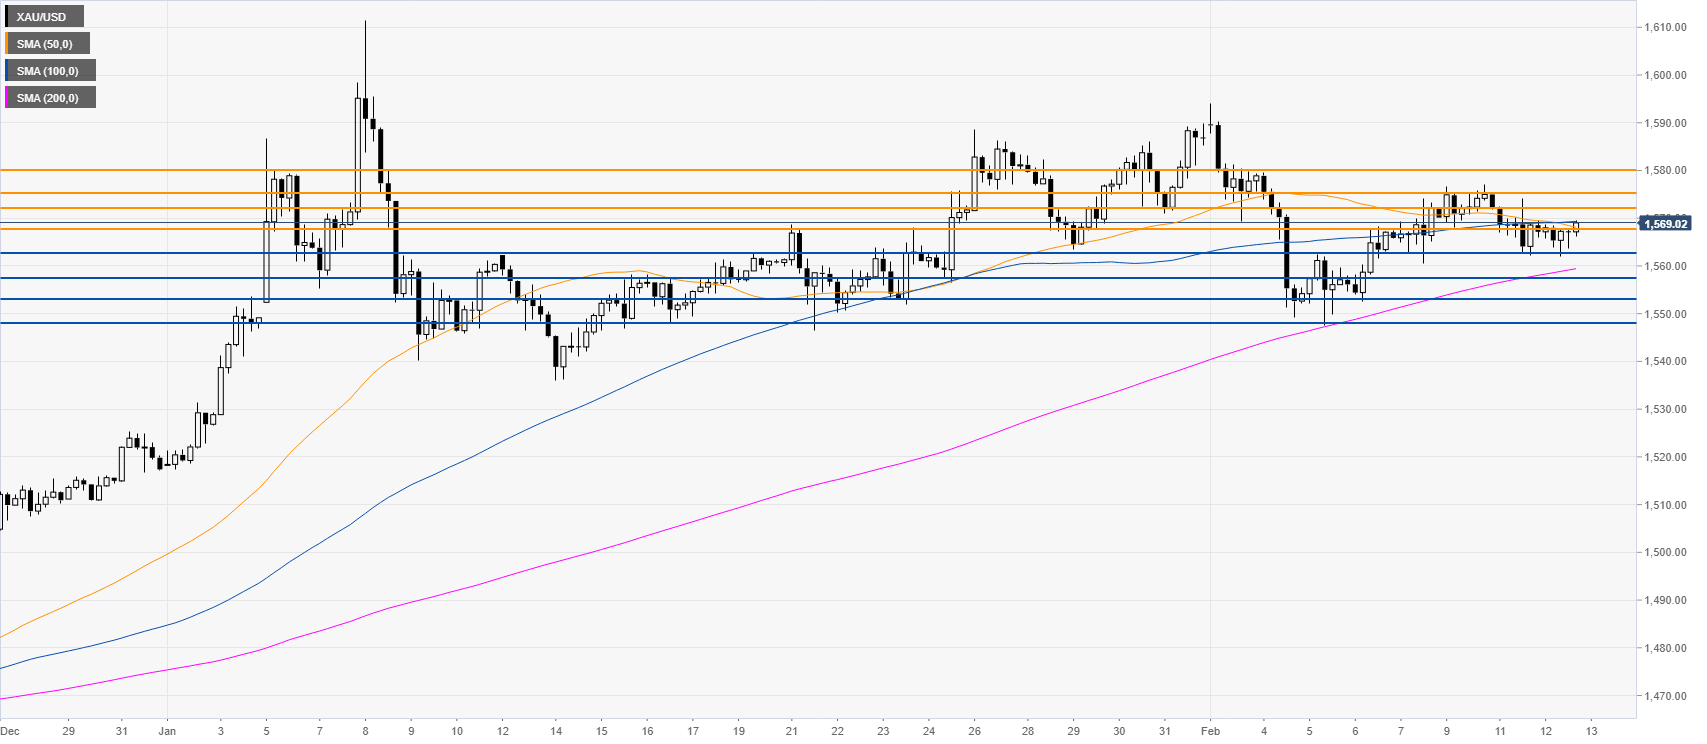
Resistance: 1567.50, 1572.39, 1575.65, 1580.00
Support: 1562.62, 1557.73, 1553.00, 1547.95
Additional key levels
Author

Flavio Tosti
Independent Analyst
More from Flavio Tosti


