Gold Price Analysis: Trapped between daily and weekly structure
- Gold prices are trapped between the daily bullish structure and the weekly bearish structure.
- The US dollar is on the backfoot, which plays into the hands of the bulls.

Gold has been capped in its recent advance to the $1,950 level as market volatility slows down and the US election nerves settle into a foregone conclusion of a Democratic Party victory.
However, there are still uncertainties left in the race which could equate to further volatility which might be required to help gold break out of its $1,865 and $1,950 range prior and into a newly formed trending market.
While stuck below weekly resistance, the monthly chart's correction may not be finished yet, despite the bullish tendencies on the lower time frames.
However, the daily reverse head and shoulders may prove to be the dominating chart pattern in the near term to tip the balance in the bull's favour once again.
The following is a top-down analysis that illustrates where gold prices stand during these elections and why there is not any opportunity jumping out from the charts until certain criteria are met.
Monthly chart
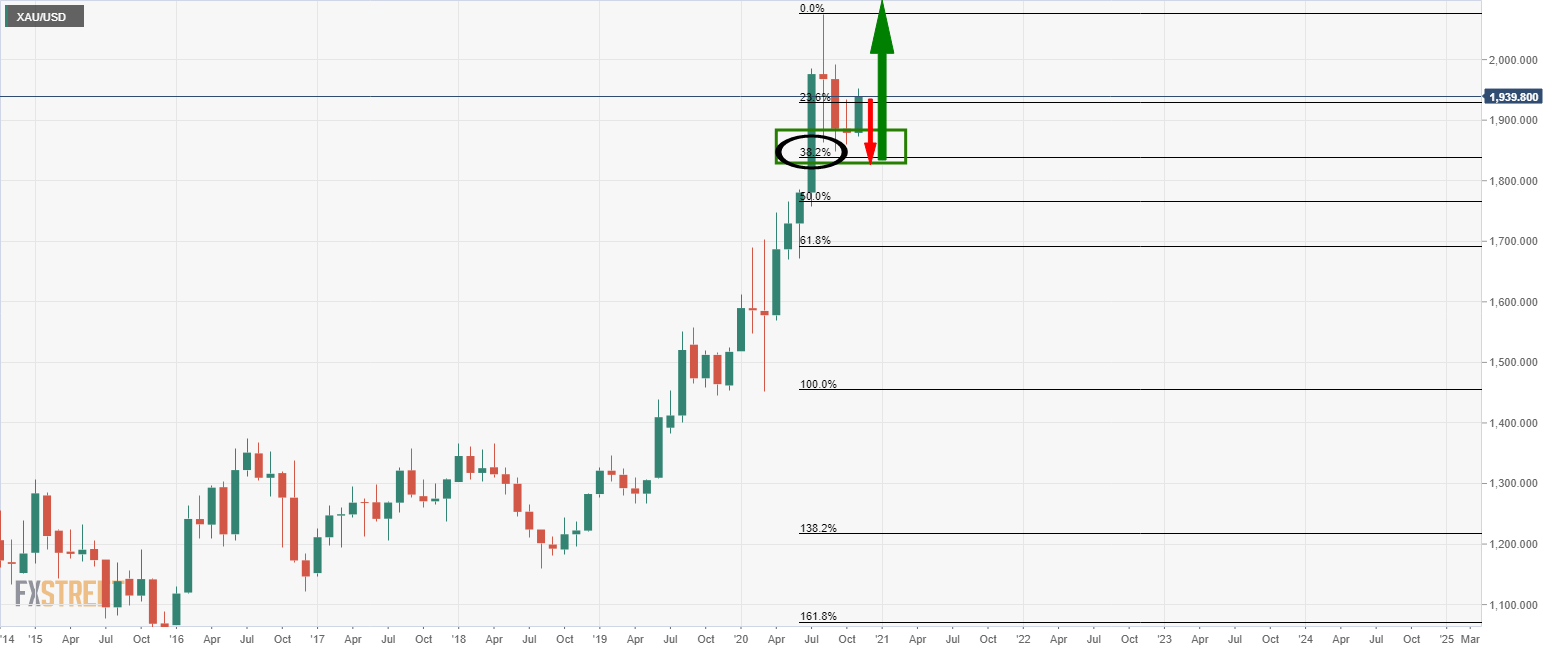
Bulls might be reluctant to fully commit knowing that the correction could still easily have more to go considering that the 38.2% Fibonacci still has not been marked.
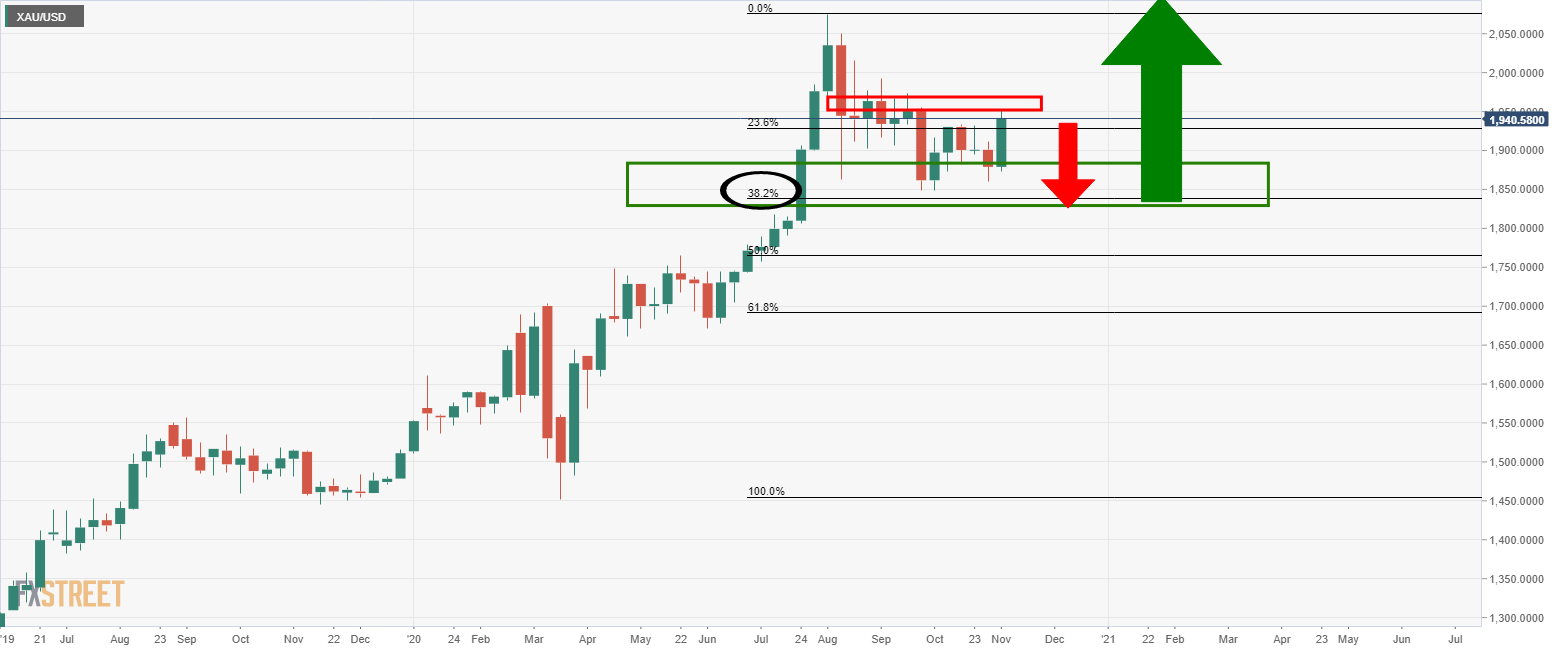
From a weekly perspective, the price is stuck below the resistance within a bullish week that still has 20-hours and some 30 minutes to go until the close.
A close below the structure will leave downside risk on the table for the forthcoming week.
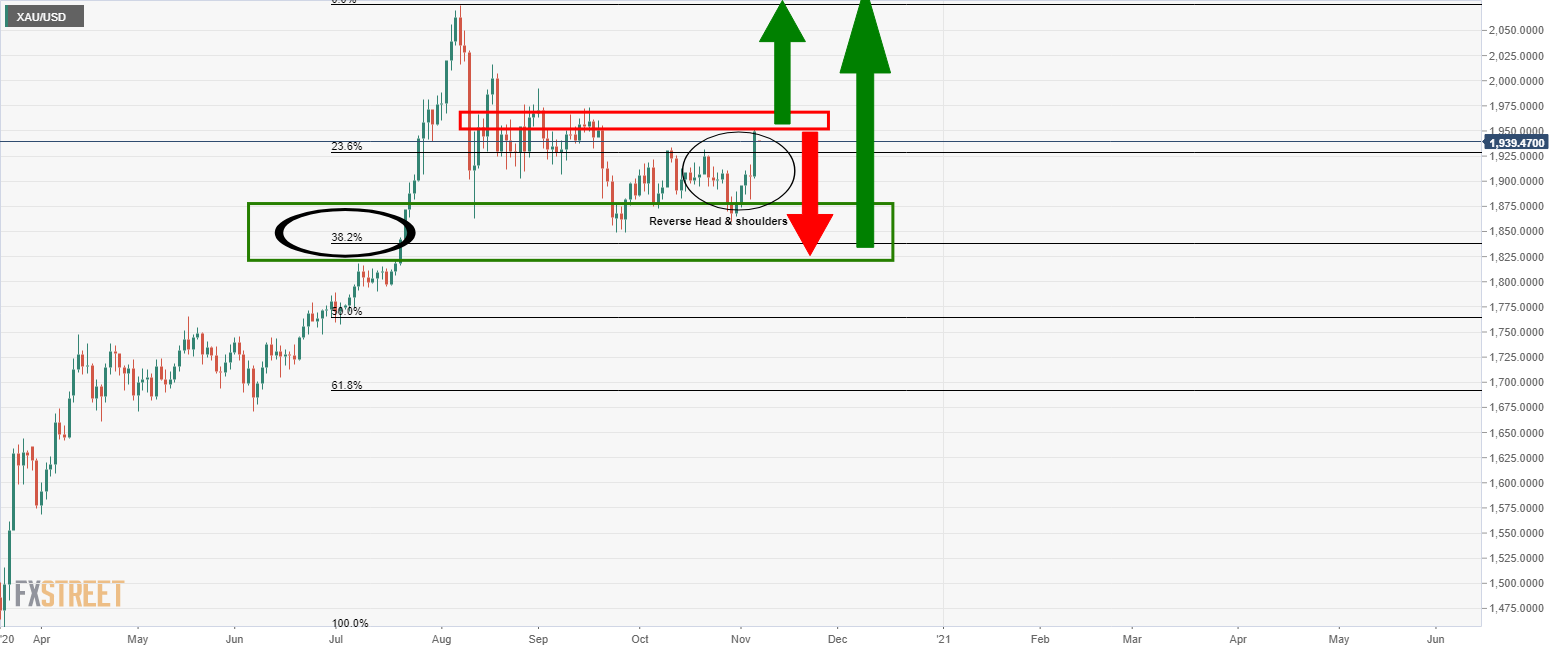
The daily chart shows that the current pattern has led to an explosive upside continuation.
However, the price is stalling on the approach to the key resistance.
On the 4-hour chart, 38.2% Fibonacci retracement has a confluence of the 8 EMA and the 21st Oct highs around 1930 which could be the next port of call for gold.
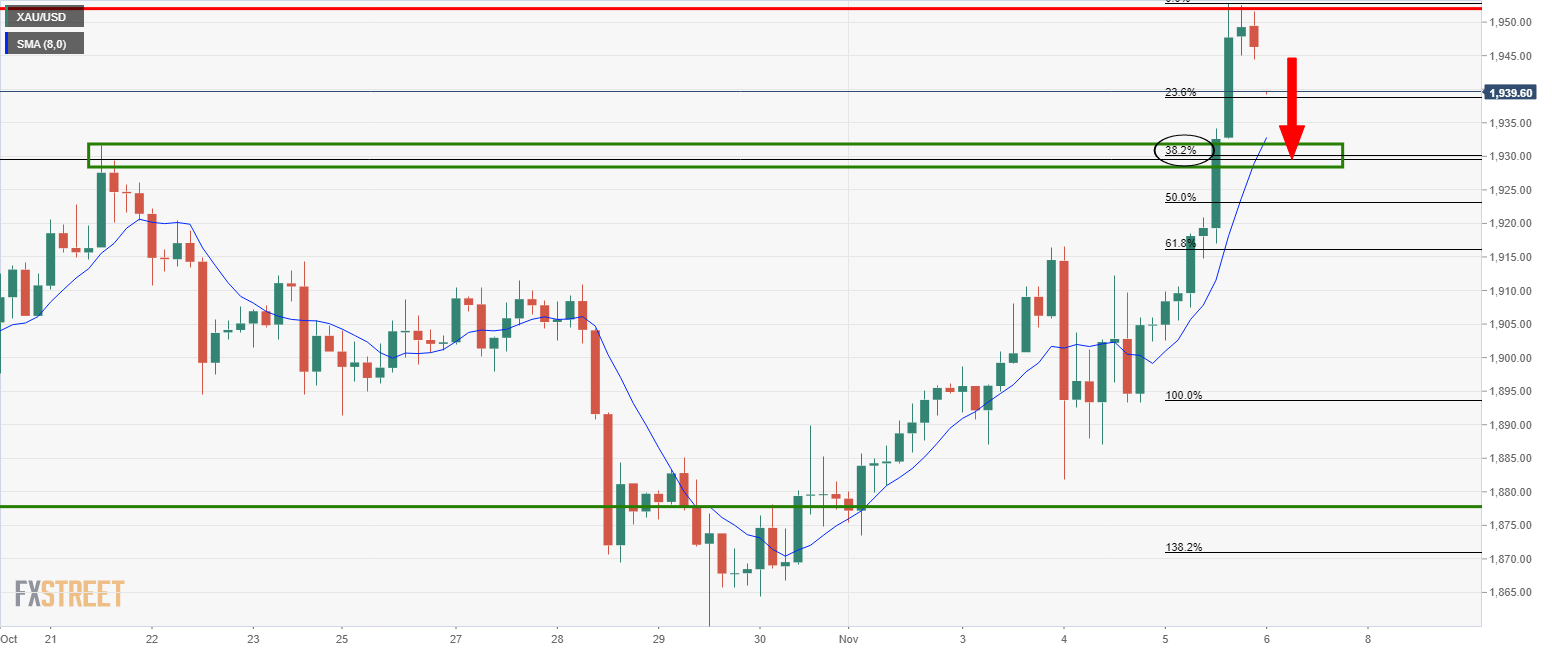
Once the correction is complete, trade setup opportunities could arise for a re-run towards the weekly structure.
If the price continues to fall, then bearosh opportunities could come into play on a restest of a newly formed bearish structure.
Author

Ross J Burland
FXStreet
Ross J Burland, born in England, UK, is a sportsman at heart. He played Rugby and Judo for his county, Kent and the South East of England Rugby team.


