Gold Price Analysis: Tide turns in favor of XAU/USD bulls, $1753 resistance eyed – Confluence Detector

Gold (XAU/USD) is jumping back on the bids, as the US dollar resumes the corrective decline after the S&P 500 futures recorded another lifetime high. The FOMC minutes revealed that the Fed is likely to continue with its accommodative monetary policy, which poured cold water on the recent tightening bets and lifted the broader market sentiment.
However, the downside in the greenback appears limited amid concerns over the passage of US infrastructure bill and renewed covid vaccine concerns. Gold traders look for fresh impetus from the Fed Chair Powell’s speech due later this Thursday.
How is gold positioned on the technical graphs?
Gold Price Chart: Key resistance and support levels
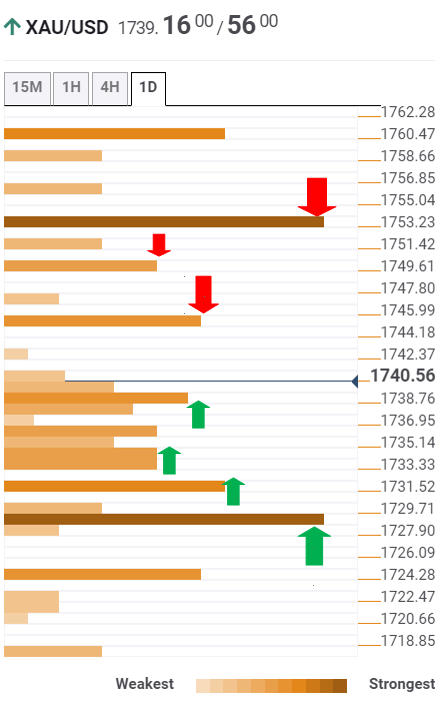
The Technical Confluences Detector shows that gold has regained poise and looks to recapture the $1745 barrier, which is the confluence of the previous day high and pivot point one-day R1.
The XAU buyers will then aim for pivot point one-week R1 at $1750.
The convergence of the Fibonacci 161.8% one-day and pivot point one-month R1 at $1753 is the level to beat for the bulls.
Further up, the previous month high at $1760 could probe the optimists.
Alternatively, immediate support is seen at $1737, the intersection of the SMA5 four-hour and SMA50 one-hour.
A stack of healthy support levels around $1734 could offer support to the XAU bulls. That area is the confluence of the SMA200 four-hour, Fibonacci 23.6% one-day and the previous week high.
The previous day lows of $1731 could test the bearish commitments, below which powerful support at $1728 could be put to test.
The latter is the meeting point of the Fibonacci 61.8% one-month and Bollinger Band one-day Middle.
Here is how it looks on the tool
About Technical Confluences Detector
The TCD (Technical Confluences Detector) is a tool to locate and point out those price levels where there is a congestion of indicators, moving averages, Fibonacci levels, Pivot Points, etc. Knowing where these congestion points are located is very useful for the trader, and can be used as a basis for different strategies.
Author

Dhwani Mehta
FXStreet
Residing in Mumbai (India), Dhwani is a Senior Analyst and Manager of the Asian session at FXStreet. She has over 10 years of experience in analyzing and covering the global financial markets, with specialization in Forex and commodities markets.


