|

Gold Price Analysis: Extends two-day gain, 15-min chart shows inverse H&S breakout

  • Gold's intraday chart shows scope for a stronger corrective rally. 
  • Macro factors, however, are aligned in favor of the bears.

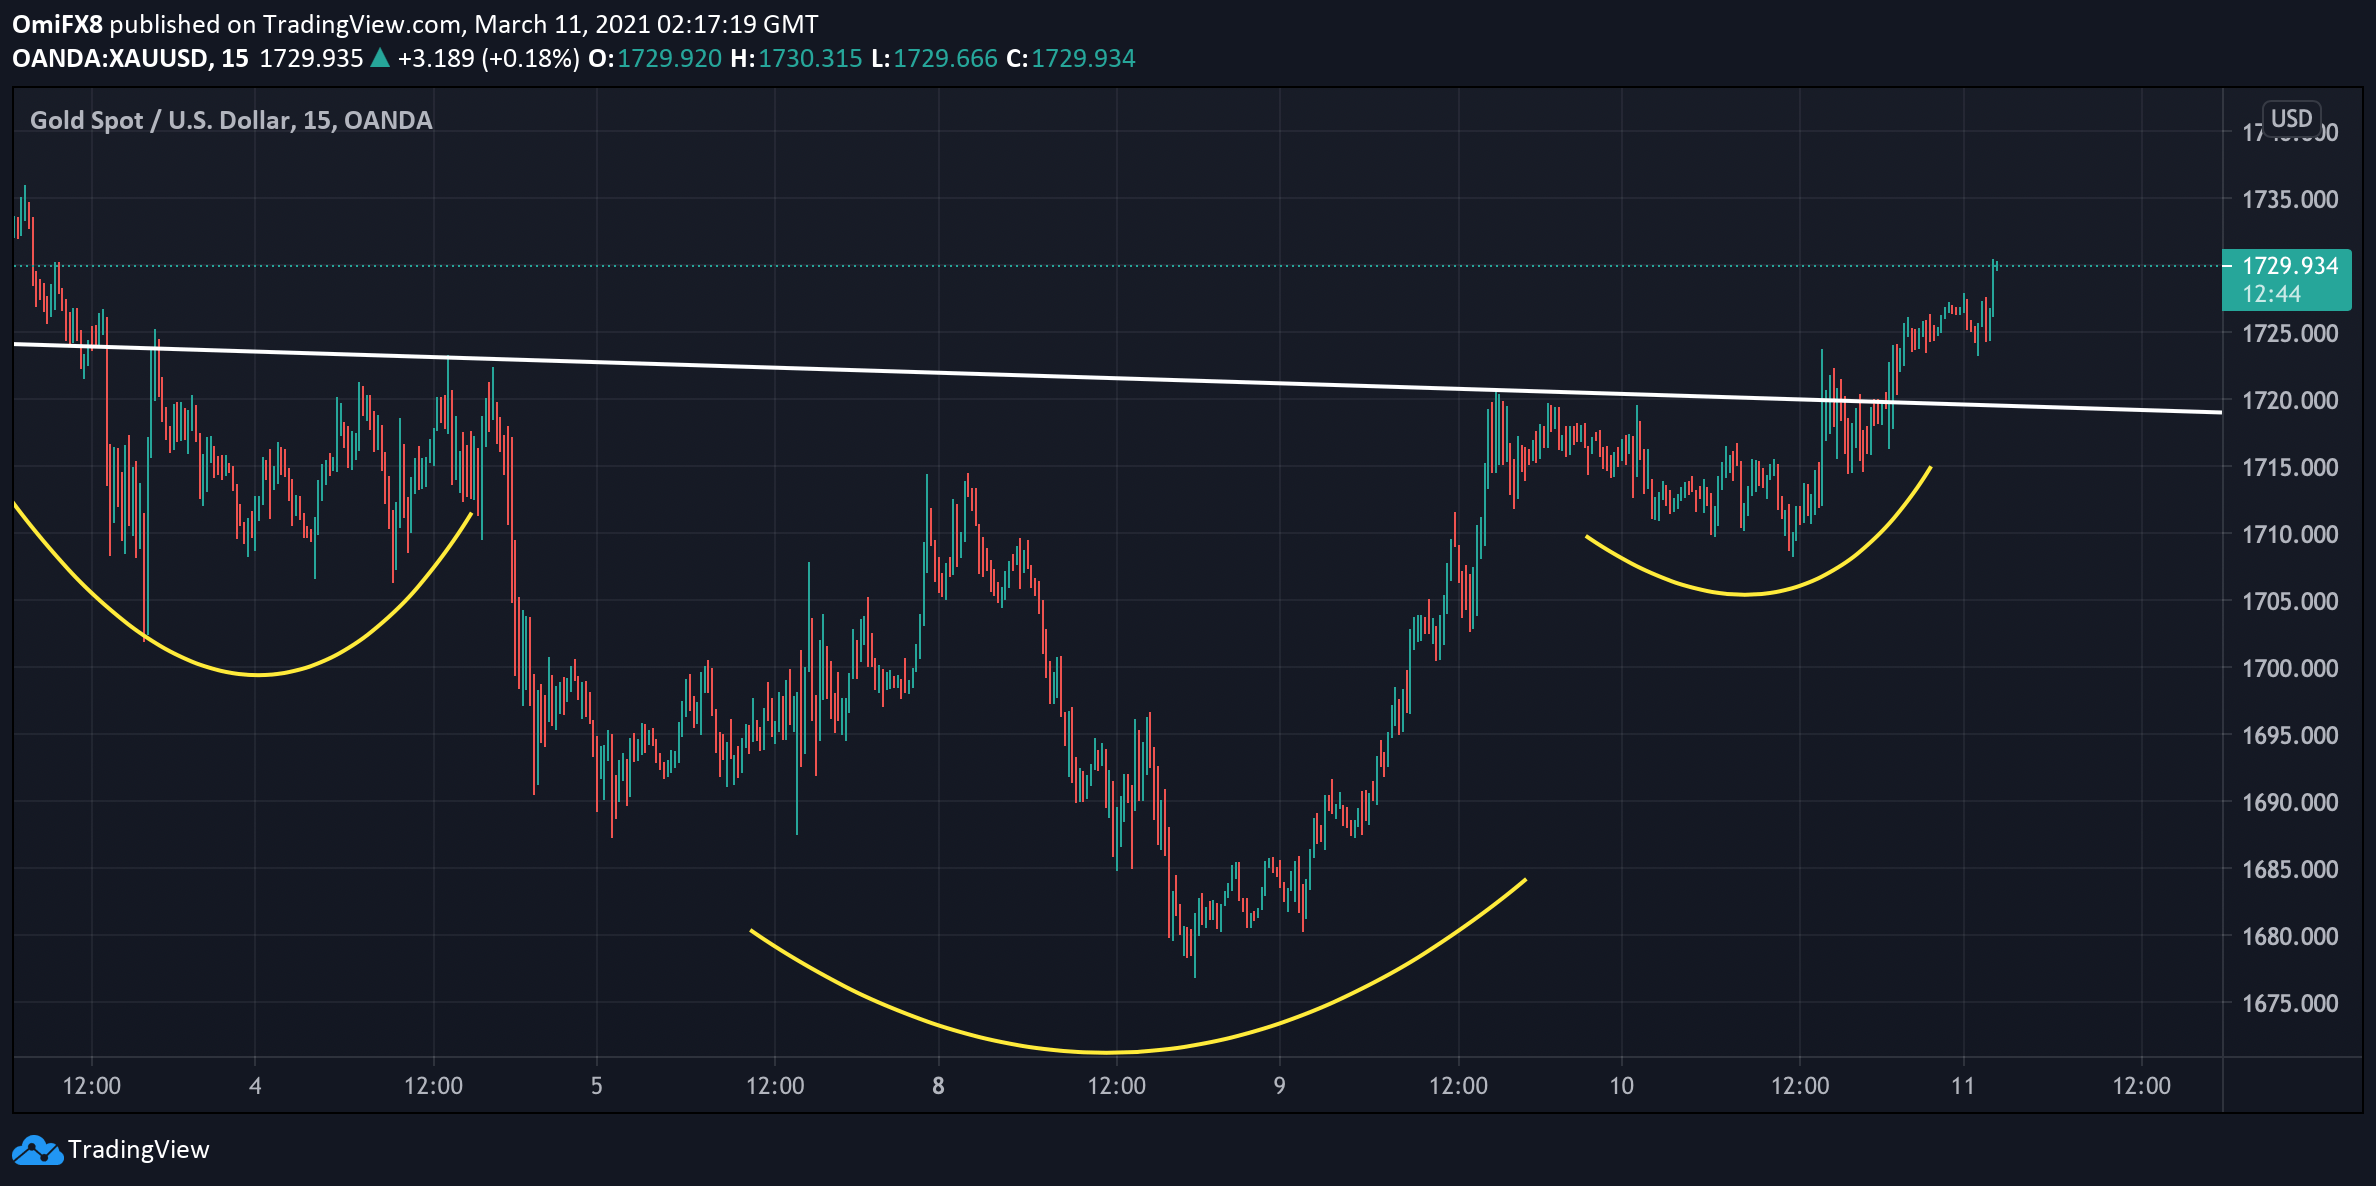
Gold is trading near $1,730 per ounce, having risen from $1,680 to $1,720 in the previous two trading days. 

The metal's 15-minute chart shows an inverse head-and-shoulders breakout, a bullish reversal pattern. The breakout has opened the doors for a rally to $1,764 – the target as per the measured move method. 

The bullish bias would be invalidated if prices drop below the former hurdle-turned-support of the inverse H&S pattern. 

President Joe Biden's $1.9 trillion stimulus plan approved by Congress on Wednesday is expected to power the US economy to its strongest economic growth rate in 40 years. Further, it could amplify inflation concerns, strengthening the case for an early tightening by the Federal Reserve (Fed). 

If that happens, the yellow metal will likely face selling pressure. Gold has declined by nearly 9% this year with markets bringing forward the timing of the first Fed rate hike to December 2022 from 2024 in the wake of rising inflation expectations. 

15-minute chart

Trend: bullish

Technical levels

BTC/USD

Overview
Today last price55959.93
Today Daily Change84.79
Today Daily Change %0.15
Today daily open55875.14
 
Trends
Daily SMA2050785.67
Daily SMA5044000.55
Daily SMA10035650
Daily SMA20024286.37
 
Levels
Previous Daily High57396.76
Previous Daily Low53032.7
Previous Weekly High52646.22
Previous Weekly Low43065.14
Previous Monthly High58355.76
Previous Monthly Low32336.85
Daily Fibonacci 38.2%55729.69
Daily Fibonacci 61.8%54699.77
Daily Pivot Point S153472.98
Daily Pivot Point S251070.81
Daily Pivot Point S349108.91
Daily Pivot Point R157837.04
Daily Pivot Point R259798.93
Daily Pivot Point R362201.1

Author

Omkar Godbole

Omkar Godbole

FXStreet Contributor

Omkar Godbole, editor and analyst, joined FXStreet after four years as a research analyst at several Indian brokerage companies.

More from Omkar Godbole
Share:

Markets move fast. We move first.

Orange Juice Newsletter brings you expert driven insights - not headlines. Every day on your inbox.

By subscribing you agree to our Terms and conditions.

Editor's Picks

EUR/USD: Sellers attack 1.1700 as USD stages a solid comeback

EUR/USD attacks 1.1700 amid heavy selling interest in the European trading hours on Wednesday. A solid comeback staged by the US Dollar weighs heavily on the pair, as traders look to USD short covering ahead of US CPI on Thursday. However, the downside could be capped by hawkish ECB expectations. 

GBP/USD slides toward 1.3300 after softer-than-expected UK inflation data

GBP/USD has come under intense selling pressure, eyeing 1.3300 in the European session on Wednesday. The UK annual headline and core CPI rose by 3.2% each, missing estimates of 3.5% and 3.4%, respectively, reaffirming dovish BoE expectations and smashing the Pound Sterling across the board. 

Gold: Bulls await breakout through multi-day-old range amid Fed rate cut bets

Gold attracts fresh buyers during the Asian session on Wednesday, though it remains confined in a multi-day-old trading range amid mixed fundamental cues. The global risk sentiment remains on the defensive amid economic woes and fears of the AI bubble burst. Moreover, dovish US Federal Reserve expectations lend support to the non-yielding yellow metal, though a modest US Dollar uptick might cap any further appreciating move.

Bitcoin, Ethereum and Ripple extend correction as bearish momentum builds

Bitcoin, Ethereum, and Ripple remain under pressure as the broader market continues its corrective phase into midweek. The weak price action of these top three cryptocurrencies by market capitalization suggests a deeper correction, as momentum indicators are beginning to tilt bearish.

Ukraine-Russia in the spotlight once again

Since the start of the week, gold’s price has moved lower, but has yet to erase the gains made last week. In today’s report we intend to focus on the newest round of peace talks between Russia and Ukraine, whilst noting the release of the US Employment data later on day and end our report with an update in regards to the tensions brewing in Venezuela.

AAVE slips below $186 as bearish signals outweigh the SEC investigation closure

Aave (AAVE) price continues its decline, trading below $186 at the time of writing on Wednesday after a rejection at the key resistance zone. Derivatives positioning and momentum indicators suggest that bearish forces still dominate in the near term.