Gold Price Analysis: Buy dips around $2008 following correction from all-time highs – Confluence Detector

Gold quickly retraced $20 from fresh all-time highs of $2031.20, as investors took profits off the table after the relentless rise. Despite the pullbacks, the path of least resistance is to the upside amid persistent downbeat tone seen around the US dollar.
Update: Gold has hit a new peak of $2,044.64 before consolidating around $2,040 at the time of writing. It seems that the precious metal is gaining more traction amid elevated media coverage and as talks between Democrats and Republicans make progress. July's Non-Farm Payrolls are approaching and signs are far from being positive. Some are already eyeing higher levels, see: Gold: Temporary pullback before moving to $2100 – TDS
The greenback remains undermined by falling US inflation-adjusted/ real Treasury yields, which sit at record lows amid worries over the US economic recovery. Meanwhile, low yields make the non-yielding gold more attractive.
Next of relevance for the metal remains the US ADP jobs report, with ‘buy the dips’ play expected, as suggested by the Confluence Detector tool.
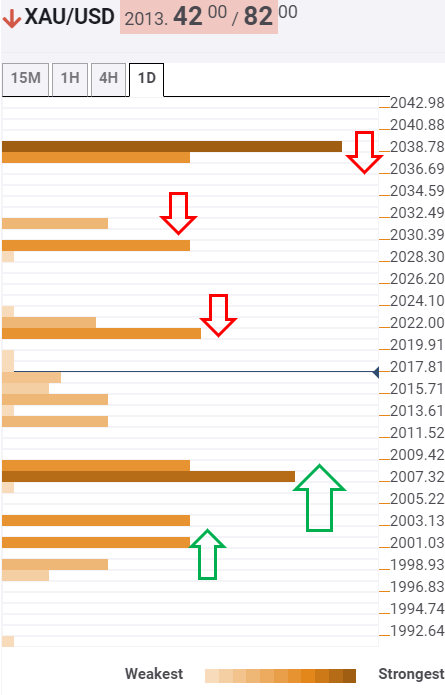
Key XAU/USD resistances and supports
The tool shows that the bright metal could find fresh bids at $2008 following a quick retracement from record highs. The convergence of the pivot point one-week R1 and Fibonacci 23.6% one-day makeup for strong support. Bargain-buyers could look for entry around that level.
On a failure to hold above that critical support, the bears will then target the next cushion around $2003/2001, which is the Fibonacci 38.2% one-day.
Further south, minor support at $1998, the intersection of SMA5 four-hour and Bollinger Band one-hour Middle could come into play.
On the flip side, immediate resistance is seen at $2020, which is the confluence of the previous day high, Bollinger Band 15-minutes Middle and SMA5 one-hour.
The next upside target awaits at $2029, the Bollinger Band one-day Upper. Acceptance above that level could open doors for a retest of the life-time highs.
Powerful resistance at $2037, where the Bollinger Band one-hour Upper and pivot point one-week R2 meet, will be a tough nut to crack for the XAU bulls.
Here is how it looks on the tool
About the Confluence Detector
The Confluence Detector finds exciting opportunities using Technical Confluences. The TC is a tool to locate and point out those price levels where there is a congestion of indicators, moving averages, Fibonacci levels, Pivot Points, etc. Knowing where these congestion points are located is very useful for the trader, and can be used as a basis for different strategies.
Author

Dhwani Mehta
FXStreet
Residing in Mumbai (India), Dhwani is a Senior Analyst and Manager of the Asian session at FXStreet. She has over 10 years of experience in analyzing and covering the global financial markets, with specialization in Forex and commodities markets.


