Gold price advances modestly ahead of US PCE data
- Gold price trades with a mild positive bias on Friday.
- The weaker USD and decline of US yields support the yellow metal.
- Investors will take more cues from the US April PCE inflation data, which is due on Friday.

Gold price (XAU/USD) advances modestly on Friday on the back of the softer US dollar (USD) and lower US yields. Traders place higher bets that the Federal Reserve (Fed) will cut the interest rate this year after the recent weaker US GDP data. Furthermore, the geopolitical risks and conflicts in the Middle East might boost the precious metal as it is perceived as a traditional safe-haven asset.
Later on Friday, gold traders will keep an eye on the US April Core Personal Consumption Expenditures Price Index (Core PCE), the Fed’s preferred inflation measure. The Core PCE figure is projected to show an increase of 0.3% MoM and 2.8% YoY in April. In case of the hotter-than-expected inflation data, this might provide some support to the Greenback and cap the upside for gold price.
Daily Digest Market Movers: Gold price rises amid geopolitical risks and weaker US GDP
- Israel is in effective control of Gaza’s entire land border after taking control of a buffer zone along the border with Egypt, Israel’s military has said, a move that may complicate its ties with Egypt, per the Guardian.
- The second estimate of US Gross Domestic Product (GDP) showed the economy expanded at an annualized pace of 1.3% in Q1 from 1.6% in the previous reading, in line with market expectations.
- The US weekly Initial Jobless Claims for the week ending May 25 rose to 219K from the previous week of 216K, above the market consensus of 218K.
- Chicago Fed President Austan Goolsbee said on Thursday that housing inflation remains a key sticking point in price growth and that the US labor market remains quite strong.
- Atlanta Fed President Raphael Bostic stated that central bankers are unlikely to deliver an interest rate cut in July amid signs that inflation progress has slowed.
- New York Fed President John Williams noted that inflation is still too high, but he is confident it will start decelerating later this year, per CNBC.
Technical analysis: Gold price remains positive on the daily timeframe
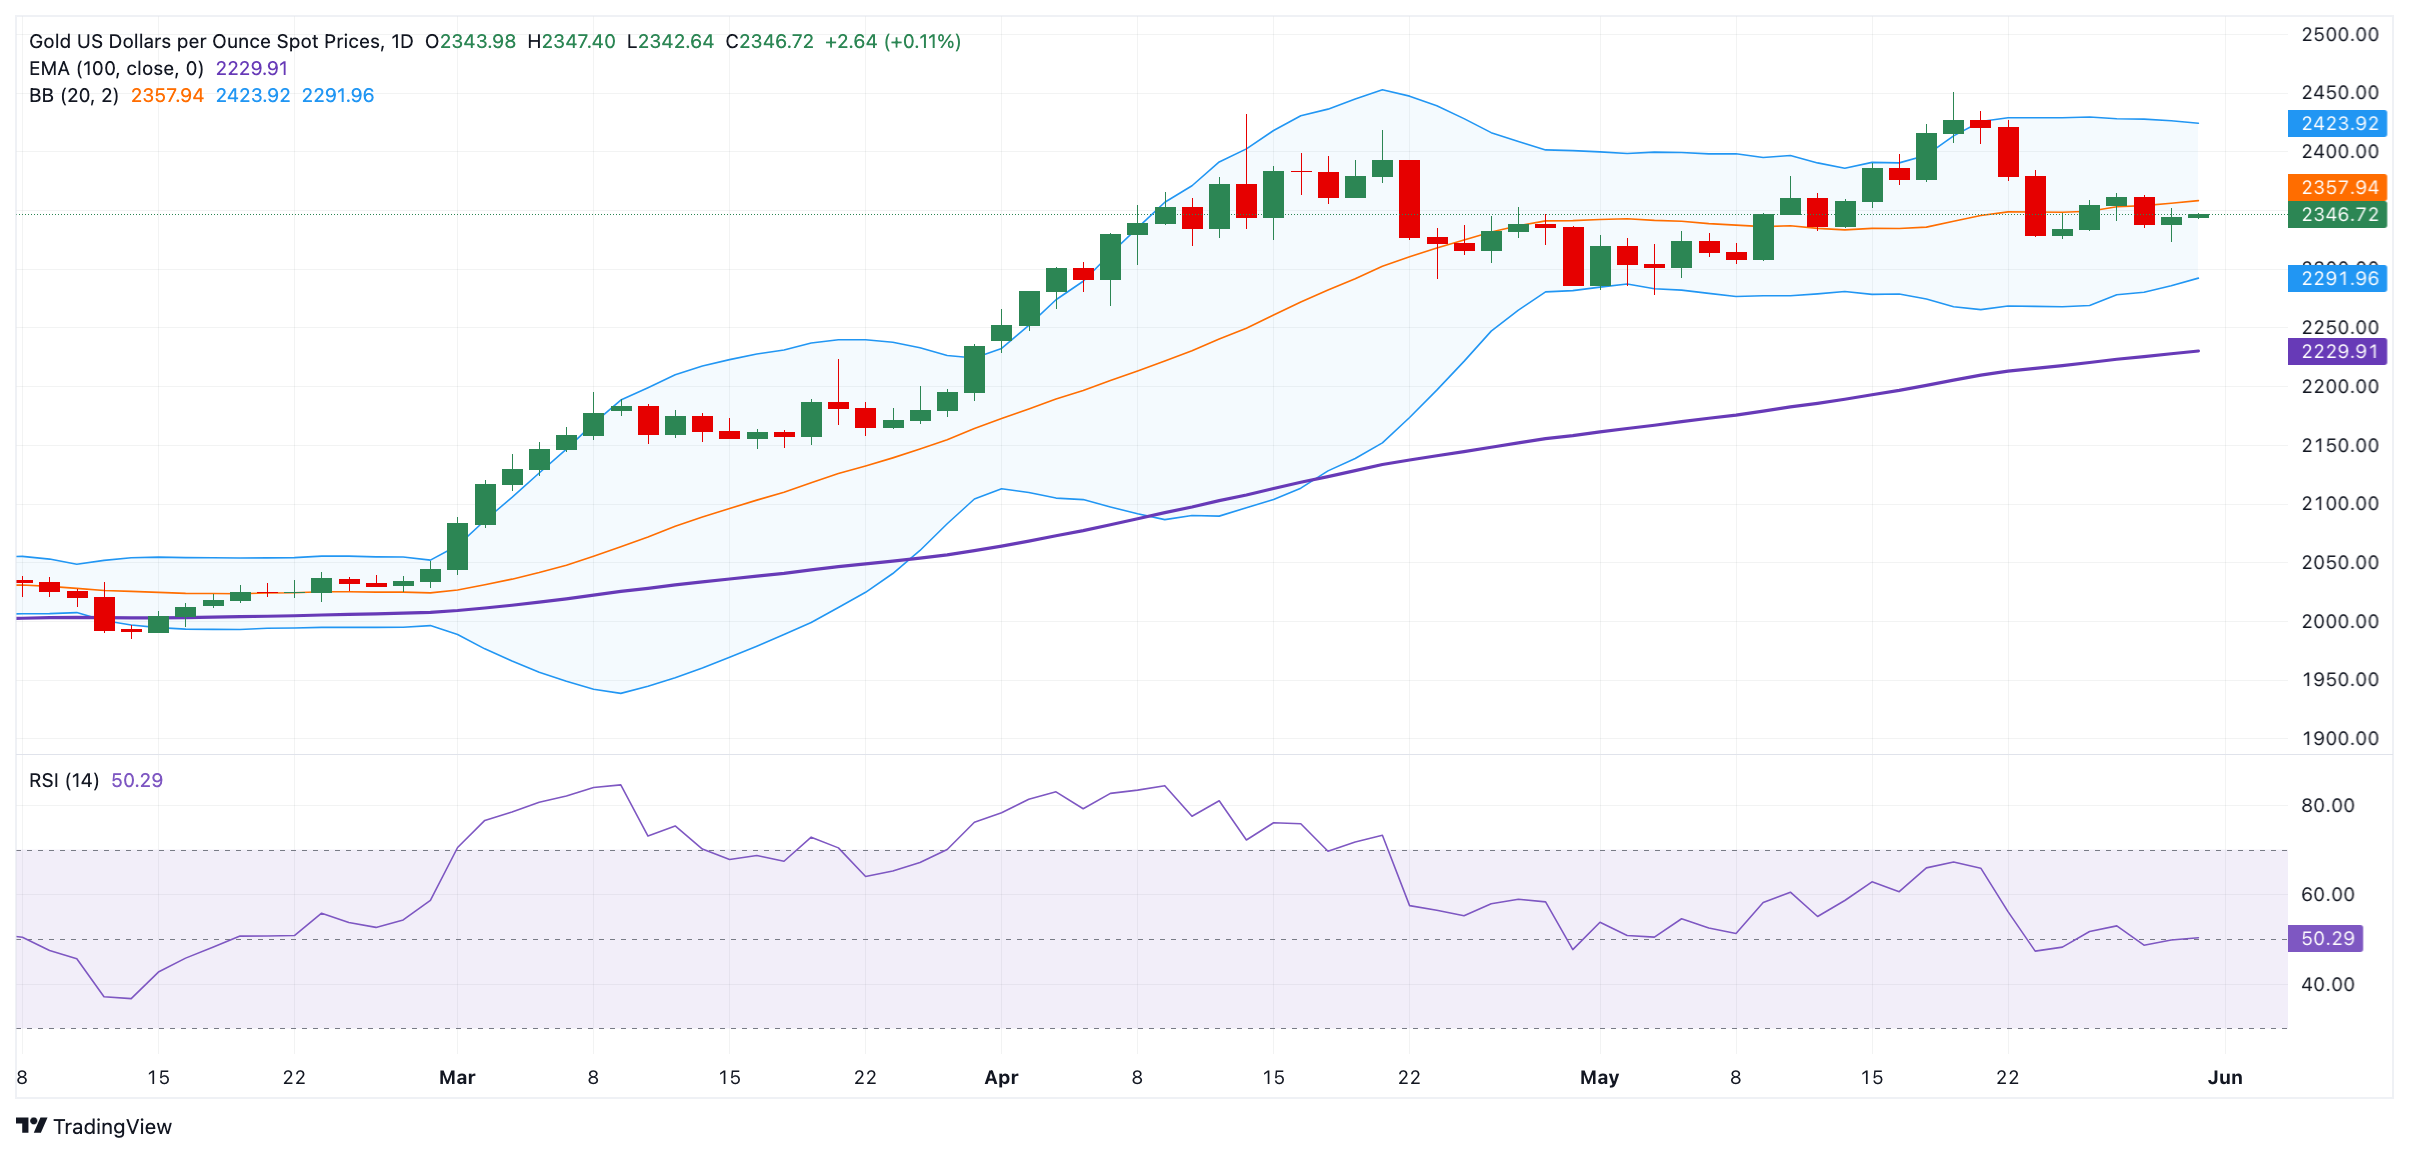
The gold price posts modest gains on the day. Technically, the yellow metal maintains the bullish picture as it is above the key 100-day Exponential Moving Average (EMA). Nonetheless, the 14-day Relative Strength Index (RSI) hovers around the 50-midline, suggesting a lack of direction for gold price and further consolidation looks favourable.
The upper boundary of the Bollinger Band near $2,425 acts as an immediate resistance level for precious metal. Any follow-through buying will see a rally to the all-time high of $2,450 en route to the $2,500 psychological barrier.
On the other hand, the key contention level will emerge at the $2,290–$2,300 region, portraying the lower limit of the Bollinger Band and the round mark. A decisive break below this level will drag the yellow metal lower to the 100-day EMA of $2,230.
US Dollar price in the last 7 days
The table below shows the percentage change of US Dollar (USD) against listed major currencies in the last 7 days. US Dollar was the weakest against the Swiss Franc.
| USD | EUR | GBP | CAD | AUD | JPY | NZD | CHF | |
| USD | -0.05% | -0.21% | -0.47% | -0.47% | -0.17% | -0.50% | -1.11% | |
| EUR | 0.05% | -0.15% | -0.41% | -0.40% | -0.11% | -0.42% | -1.06% | |
| GBP | 0.21% | 0.15% | -0.26% | -0.25% | 0.06% | -0.27% | -0.90% | |
| CAD | 0.45% | 0.44% | 0.26% | 0.00% | 0.30% | -0.01% | -0.65% | |
| AUD | 0.46% | 0.40% | 0.24% | -0.01% | 0.29% | -0.02% | -0.64% | |
| JPY | 0.15% | 0.11% | -0.05% | -0.31% | -0.31% | -0.29% | -0.95% | |
| NZD | 0.50% | 0.42% | 0.27% | 0.01% | 0.02% | 0.31% | -0.64% | |
| CHF | 1.09% | 1.06% | 0.90% | 0.63% | 0.63% | 0.93% | 0.60% |
The heat map shows percentage changes of major currencies against each other. The base currency is picked from the left column, while the quote currency is picked from the top row. For example, if you pick the Euro from the left column and move along the horizontal line to the Japanese Yen, the percentage change displayed in the box will represent EUR (base)/JPY (quote).
Interest rates FAQs
Interest rates are charged by financial institutions on loans to borrowers and are paid as interest to savers and depositors. They are influenced by base lending rates, which are set by central banks in response to changes in the economy. Central banks normally have a mandate to ensure price stability, which in most cases means targeting a core inflation rate of around 2%. If inflation falls below target the central bank may cut base lending rates, with a view to stimulating lending and boosting the economy. If inflation rises substantially above 2% it normally results in the central bank raising base lending rates in an attempt to lower inflation.
Higher interest rates generally help strengthen a country’s currency as they make it a more attractive place for global investors to park their money.
Higher interest rates overall weigh on the price of Gold because they increase the opportunity cost of holding Gold instead of investing in an interest-bearing asset or placing cash in the bank. If interest rates are high that usually pushes up the price of the US Dollar (USD), and since Gold is priced in Dollars, this has the effect of lowering the price of Gold.
The Fed funds rate is the overnight rate at which US banks lend to each other. It is the oft-quoted headline rate set by the Federal Reserve at its FOMC meetings. It is set as a range, for example 4.75%-5.00%, though the upper limit (in that case 5.00%) is the quoted figure. Market expectations for future Fed funds rate are tracked by the CME FedWatch tool, which shapes how many financial markets behave in anticipation of future Federal Reserve monetary policy decisions.
Author

Lallalit Srijandorn
FXStreet
Lallalit Srijandorn is a Parisian at heart. She has lived in France since 2019 and now becomes a digital entrepreneur based in Paris and Bangkok.


