|

Gold Miners Junior (GDXJ) looking for vorrection to rnd doon [Video]

The VanEck Junior Gold Miners ETF (GDXJ) is an exchange-traded fund that tracks the overall performance of small-cap companies primarily involved in gold and silver mining. GDXJ includes a diverse portfolio of junior miners, which are smaller, often early-stage companies with significant growth potential.

GDXJ monthly Elliott Wave view

Chart

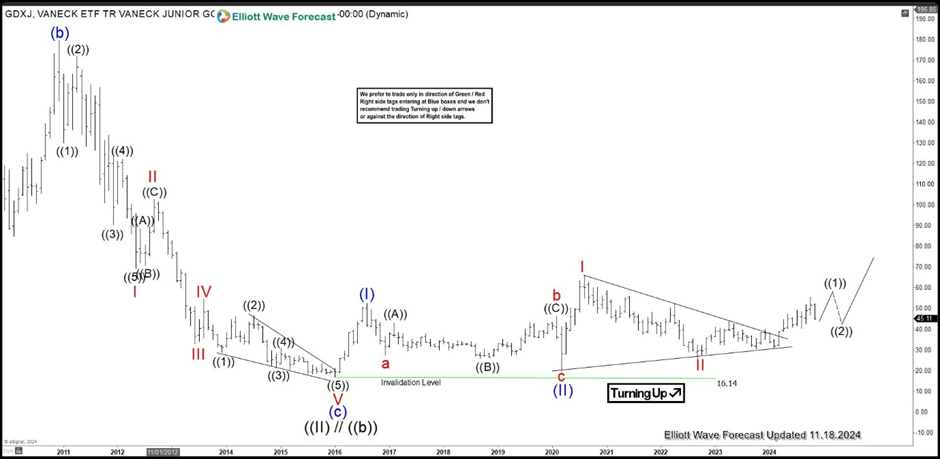
Monthly Elliott Wave view in Gold Miners Junior ETF (GDXJ) above shows that the ETF ended wave ((II)) or ((B)) at 16.14. The ETF is then rallying higher as a nested impulse. Up from wave ((II)), wave (I) ended at 52.5 and wave (II) pullback ended at 19.52. Wave (III) is currently in progress as another impulse in lesser degree. Rally in wave I ended at 65.95. Pullback in wave II then ended at 25.80. the ETF should continue to rally higher as far dips stay above wave II at 25.8 in the first degree, and more importantly above wave ((II)) low at 16.14.

GDXJ daily Elliott Wave view

Chart

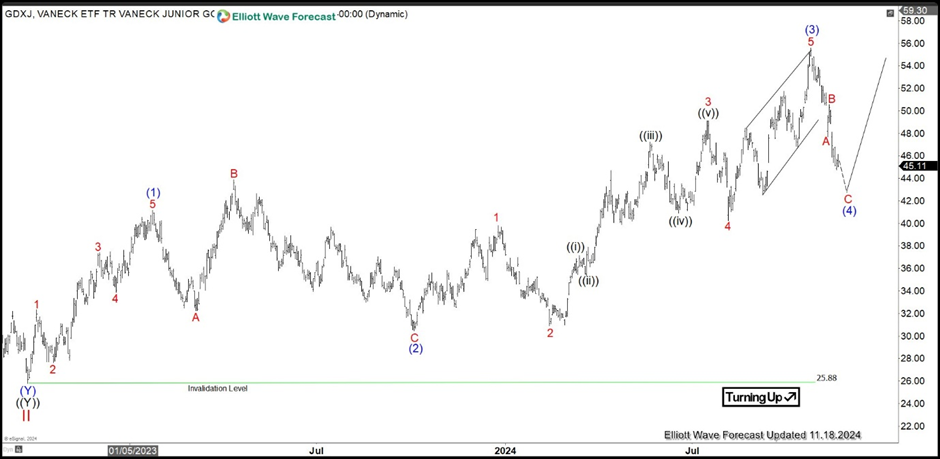
Daily Elliott Wave Chart of GDXJ shows that rally in wave III is in progress as an impulse. Up from wave II, wave (1) ended at 41.16. Wave (2) pullback ended at 30.46 with internal subdivision as an expanded flat. Wave (3) ended at the recent peak at 55.58 and wave (4) pullback is now in progress to correct cycle from 10.4.2023 low. Potential support comes at 100% – 161.8% Fibonacci extension of wave A which comes at 38.1 – 42.8 area. While dips stay above 25.88 in the first degree, expect the ETF to find buyers in 3, 7, or 11 swing for further upside.

GDXJ Elliott Wave [Video]

Author

Elliott Wave Forecast Team

Elliott Wave Forecast Team

ElliottWave-Forecast.com

More from Elliott Wave Forecast Team
Share:

Editor's Picks

AUD/USD falls to near 0.7100 after slipping below 50-day EMA

AUD/USD depreciates after registering minor gains in the previous day, trading around 0.7120 during the Asian hours. The technical analysis of the daily chart shows the pair consolidating sideways within a rectangle pattern, as neither bulls nor bears gain control. The AUD/USD pair is holding a slight bearish tone however as it sits beneath both the nine-day and 50-day EMAs.

160.00: USD/JPY back near intervention territory after upbeat US jobs report

US Nonfarm Payrolls beat expectations by a wide margin in May, with 172K jobs added. The US Dollar rebounds after the release, helping USD/JPY recover from its intraday lows. Warnings from Japanese authorities continue to limit upside potential near the 160.00 threshold.

Gold targets $4,300 amid stronger Dollar

Gold faces increasing selling interest and navigates the area of three-month lows near the $4,300 mark per troy ounce on Friday. The precious metal’s decline comes as traders assess the stronger-than-expected NFP, while the bid bias in the Greenback and higher US Treasury yields also collaborate with the retracement.

Cardano hits five-year low even as Hoskinson clarifies "break" isn't an exit

Cardano (ADA) price is down 10% at press time on Friday, extending losses over 30% so far this week amid Charles Hoskinson's clarification that "break" isn't an exit.

Week ahead – Fed countdown begins amid US inflation data and geopolitical risks

Fed Chair Warsh’s first meeting approaches as key US inflation data could reshape expectations. Oil prices remain elevated as US-Iran talks continue; tariffs also return to the spotlight. ECB is expected to hike; will it be a one-off move or is July live?

The US economy defies the rules: 100 days into the Oil shock and the recession signal is still missing

More than three months after the start of the Iran war and the resulting disruption to global energy markets, the US economy continues to display remarkable resilience. The conflict has triggered a sharp rise in Oil prices, reignited inflationary pressures and fueled widespread concerns about a potential economic slowdown.