|

GBP/USD technical analysis: The Cable is sidelined near the 1.2340 level

  • The Sterling is consolidating its gains for the third consecutive day.
  • The level to beat for bears is at 1.2313 support. 
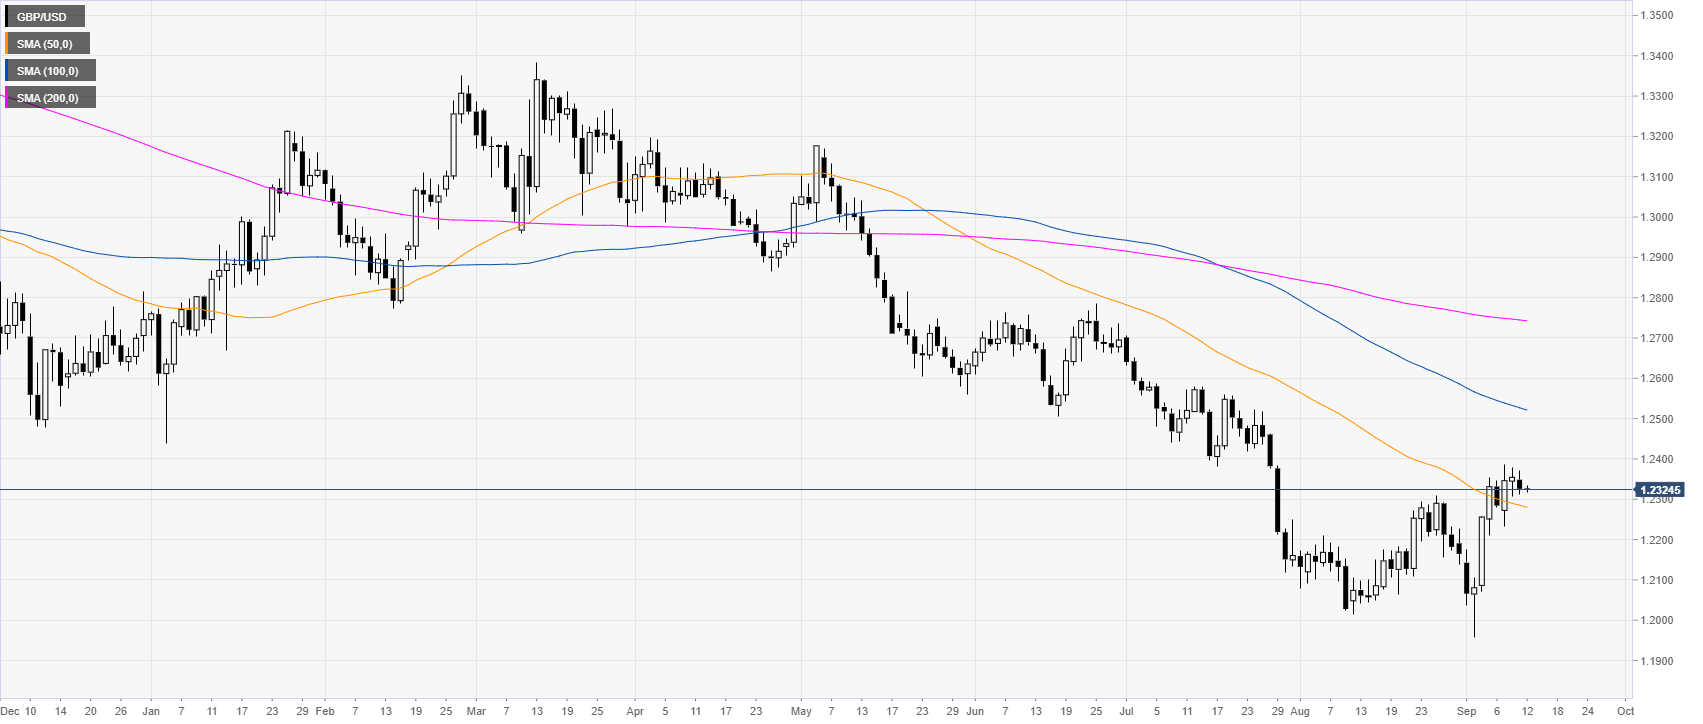
 

GBP/USD daily chart

 
The Pound is trading in a bear trend below the 100 and 200-day simple moving averages (SMAs). GBP/USD is consolidating its advance below the 1.2400 figure.

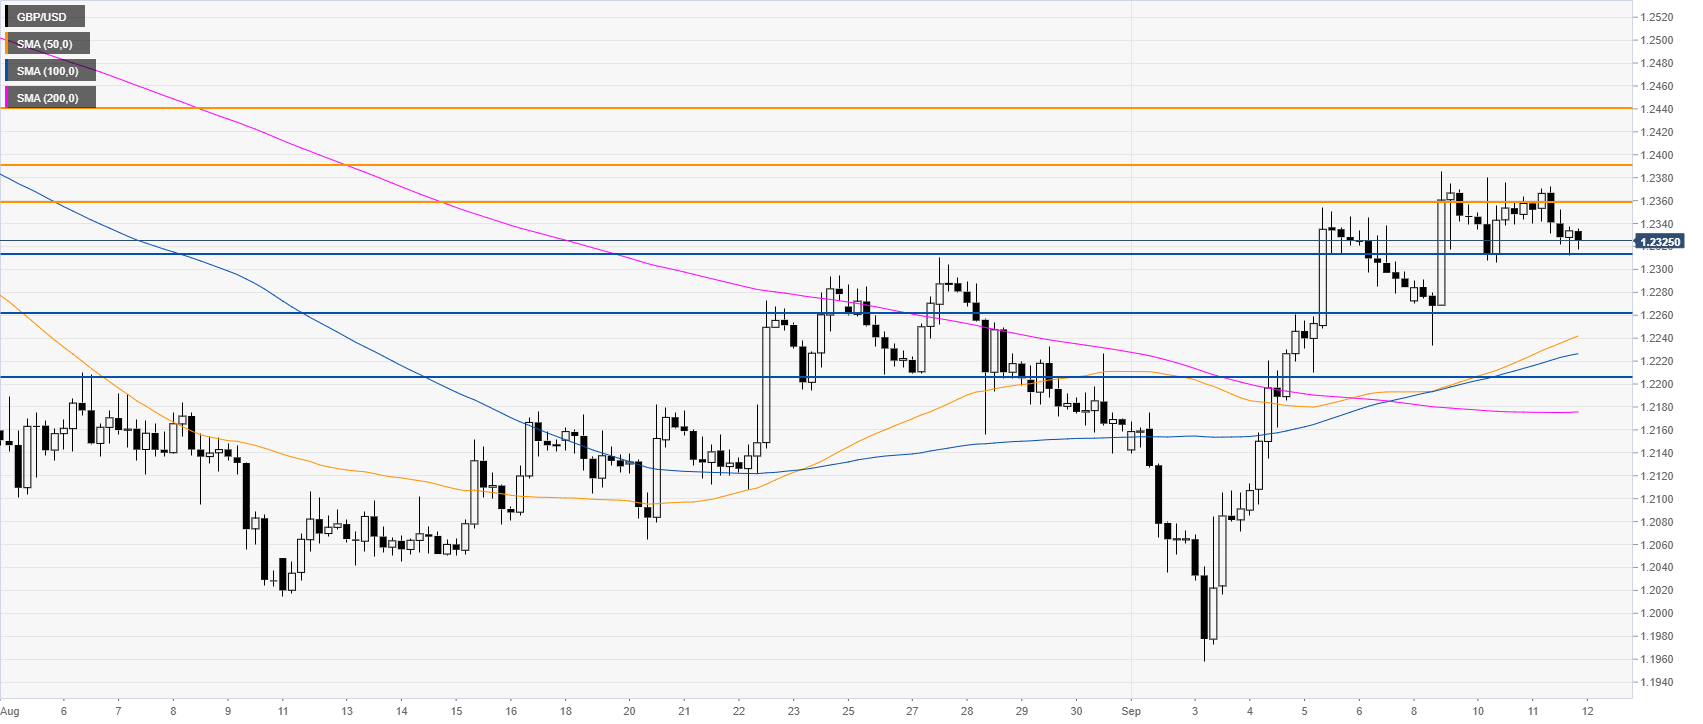
GBP/USD four-hour chart

 
GBP/USD is parked just above 1.2313 support as the market is trading above its main SMAs. Bulls need a daily close above the 1.2390 level to attract buying interest toward 1.2440 resistance levels, according to the Technical Confluences Indicator


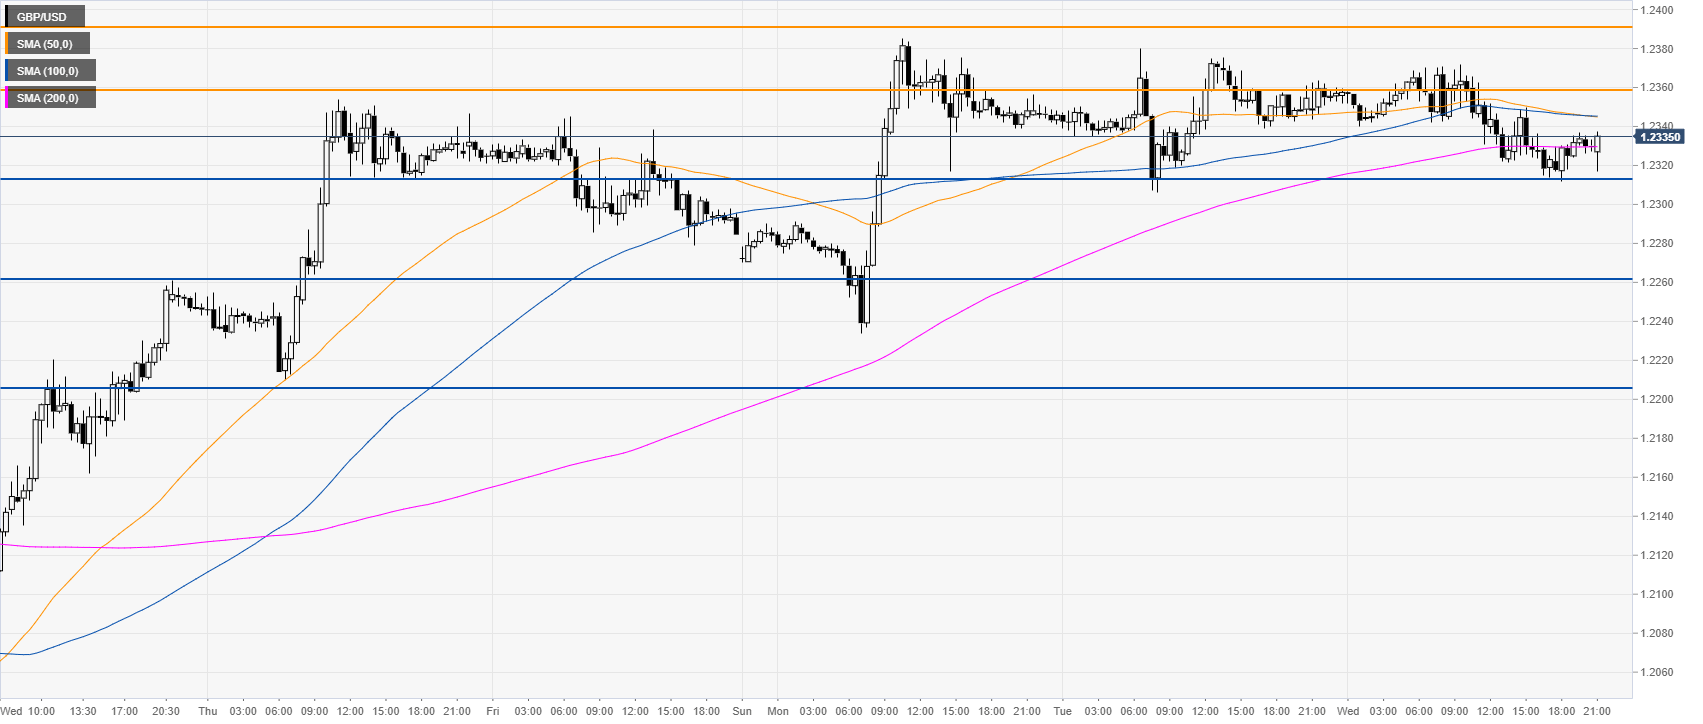
GBP/USD 30-minute chart

 
The Pound is trading just below the main SMAs, suggesting bearish momentum in the near term. Sellers are looking for a clear break of the 1.2313 key support to reach 1.2262 and 1.2205 levels to the downside, according to the Technical Confluences Indicator. 
 

Additional key levels

GBP/USD

Overview
Today last price1.2328
Today Daily Change-0.0026
Today Daily Change %-0.21
Today daily open1.2354
 
Trends
Daily SMA201.2202
Daily SMA501.229
Daily SMA1001.2533
Daily SMA2001.2747
Levels
Previous Daily High1.238
Previous Daily Low1.2306
Previous Weekly High1.2354
Previous Weekly Low1.1958
Previous Monthly High1.231
Previous Monthly Low1.2015
Daily Fibonacci 38.2%1.2352
Daily Fibonacci 61.8%1.2334
Daily Pivot Point S11.2314
Daily Pivot Point S21.2273
Daily Pivot Point S31.224
Daily Pivot Point R11.2388
Daily Pivot Point R21.2421
Daily Pivot Point R31.2462

Author

Flavio Tosti

Flavio Tosti

Independent Analyst


More from Flavio Tosti
Share:

Editor's Picks

EUR/USD eyes nine-day EMA barrier after rebounding from 1.1600

EUR/USD gains ground after registering modest losses in the previous session, trading around 1.1620 during the Asian hours on Friday. The technical analysis of the daily chart suggests an ongoing bearish bias as the pair remains within the descending channel pattern.

GBP/USD drifts lower heading into NFP range

GBP/USD edged lower by 0.2% on Thursday, settling close to 1.3350 in a strained trading session that kept the pair pinned near three-month lows. Price briefly recovered earlier in the day on reports that Iran had indirectly signaled openness to talks with the CIA, but the bounce faded as Israeli officials reportedly advised Washington to disregard the overture. 

Gold awaits US Nonfarm Payrolls for a clear directional impetus

Gold rebounds above $5,100 early Friday after testing the $5,050 level amid global sell-off. The US Dollar pulls back as profit-taking creeps in ahead of US labor data. For February. 21-day SMA holds amid bullish RSI; a daily closing above 61.8% Fibo is critical for Gold buyers.

Ethereum pull in $169M as validators pile in to stake ETH

US spot Ethereum exchange-traded funds recorded $169 million in net inflows on Wednesday, marking the largest daily intake in two months, according to SoSoValue data. The rise in inflows signals renewed institutional interest in Ethereum amid broader market volatility.

The market compass is pointing at a barrel of Oil

The Asian open is arriving with equities leaning the wrong way, and the reason is not complicated. The market’s compass needle has snapped firmly toward crude. In this tape, oil is not just another input price; it is the gravitational center around which every asset class is orbiting.

Ripple tests recovery strength amid steady ETF inflows, growing retail interest

Ripple (XRP) continues to demonstrate notable resilience as the cryptocurrency market navigates the persistent war in the Middle East after the United States (US) and Israel attacked Iran on Saturday.