|

GBP/USD Technical Analysis: The 1.2600 figure is back on the bears radar screen as USD strengthens
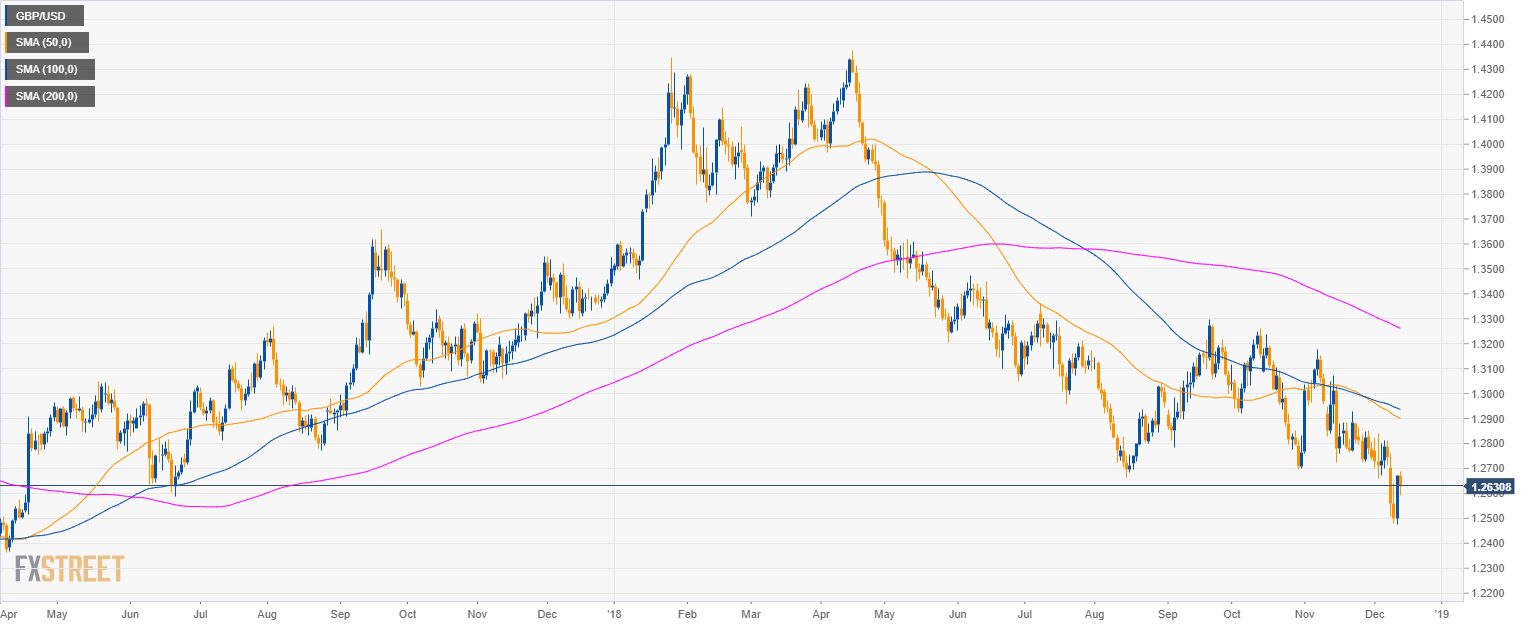
GBP/USD daily chart

  • GBP/USD is trading in a bear trend below the 50, 100 and 200-day simple moving averages.

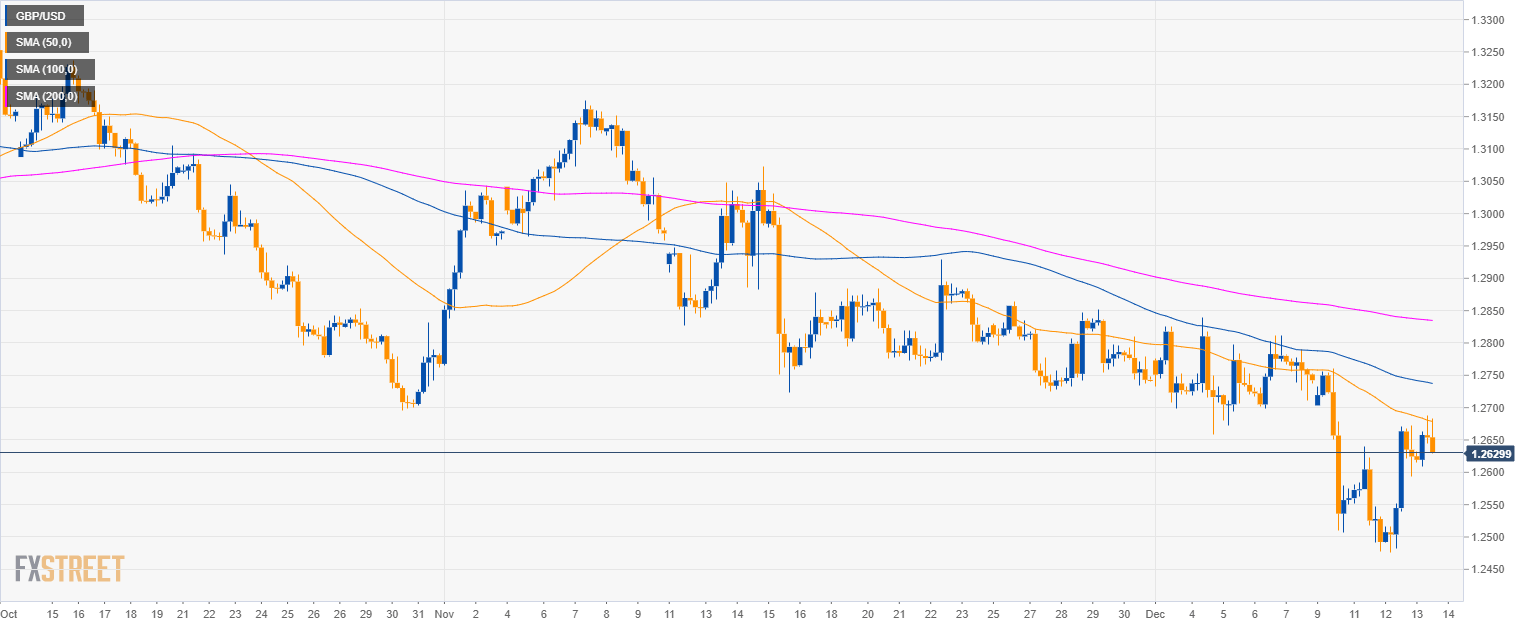
GBP/USD 4-hour chart

  • GBP/USD tested the 50 SMA and the 1.2700 figure.

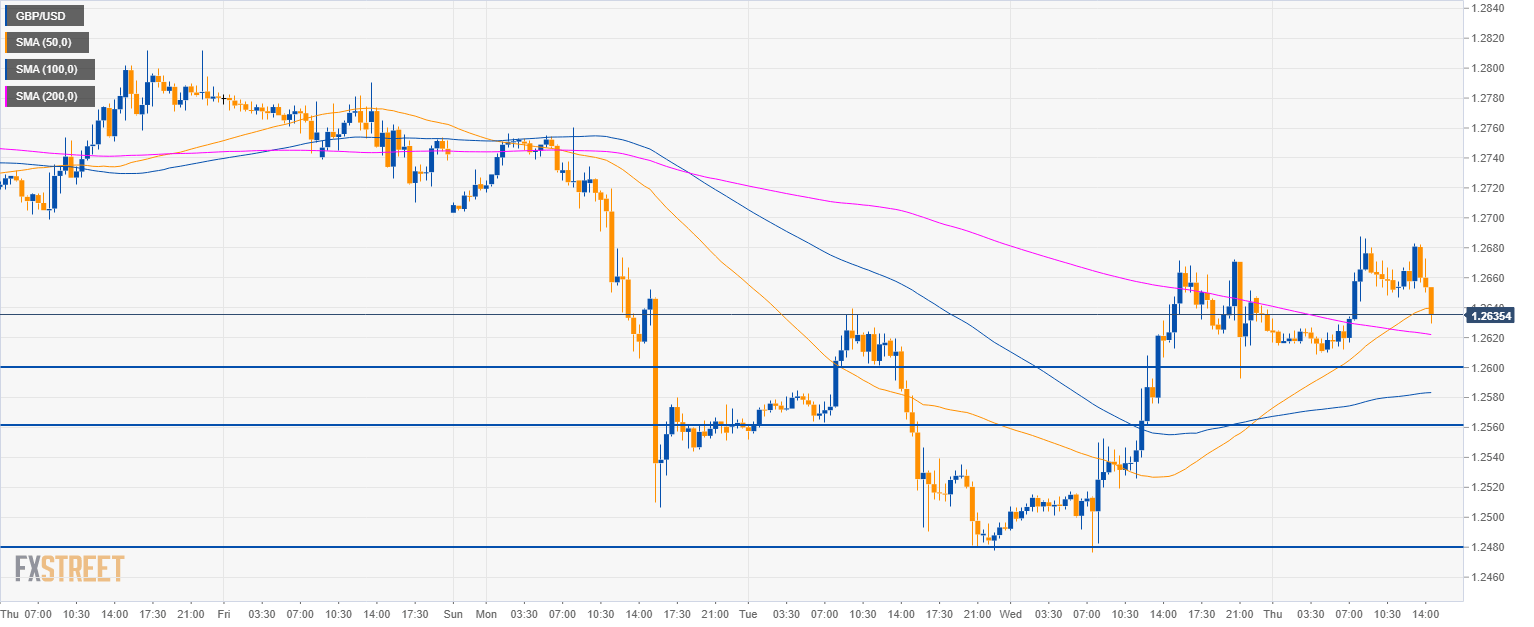
GBP/USD 30-minute chart

  • GBP/USD is set to weaken and revisit 1.2600 figure.  
  • A break below 1.2600 should open the gates to 1.2560 and the 1.2480 level.

Additional key levels

GBP/USD

Overview:
    Today Last Price: 1.2632
    Today Daily change: -39 pips
    Today Daily change %: -0.308%
    Today Daily Open: 1.2671
Trends:
    Previous Daily SMA20: 1.2752
    Previous Daily SMA50: 1.2907
    Previous Daily SMA100: 1.2941
    Previous Daily SMA200: 1.3269
Levels:
    Previous Daily High: 1.2672
    Previous Daily Low: 1.2477
    Previous Weekly High: 1.284
    Previous Weekly Low: 1.2659
    Previous Monthly High: 1.3176
    Previous Monthly Low: 1.2723
    Previous Daily Fibonacci 38.2%: 1.2598
    Previous Daily Fibonacci 61.8%: 1.2551
    Previous Daily Pivot Point S1: 1.2541
    Previous Daily Pivot Point S2: 1.2411
    Previous Daily Pivot Point S3: 1.2346
    Previous Daily Pivot Point R1: 1.2736
    Previous Daily Pivot Point R2: 1.2802
    Previous Daily Pivot Point R3: 1.2932

Author

Flavio Tosti

Flavio Tosti

Independent Analyst


More from Flavio Tosti
Share:

Editor's Picks

EUR/USD retreats below 1.1800 following earlier rebound

EUR/USD loses its recovery momentum and trades little-changed on the day below 1.1300 in the second half of the day on Wednesday. The modest improvement seen in risk mood limits the US Dollar's gains and allows the pair to hold its ground.

GBP/USD clings to small gains above 1.3500

GBP/USD is posting moderate gains above 1.3500 on Wednesday. The pair edges higher as the US Dollar meets fresh supply amid a modest improvement seen in risk sentiment following US President Donald Trump’s first State of the Union address.

Gold rises toward $5,200, supported by geopolitics and trade jitters

Gold buyers are back in the game, eyeing $5,200 and beyonf on Wednesday after seeing a correction from monthly highs on Tuesday. The US Dollar slips after Trump’s SOTU fails to impress and as AI-driven worries ease. Dovish Fed bets also weigh.  Gold looks north so long as the key 61.8% Fibo resistance at $5,142 holds on the daily chart.

Bitcoin, Ethereum and Ripple post cautious recovery amid downside risks

Bitcoin, Ethereum, and Ripple are posting a cautious recovery on Wednesday following a market correction earlier this week.  BTC is approaching a key breakdown level, while ETH and XRP are rebounding from crucial support levels.

Nvidia remains at the heart of the AI boom

Nvidia remains at the heart of the AI boom, with Q4 revenue projected near $65.6–66.1 billion, nearly 70% higher year-over-year. But investors are watching cash flow, leverage, and broader AI adoption. Growth is strong, but the AI stress isn’t over.

Cosmos Hub Price Forecast: ATOM rebounds slightly, bearish outlook remains intact

Cosmos Hub (ATOM) price rebounds, trading above $2.05 at the time of writing on Wednesday, after undergoing a sharp correction since last week. Weakening on-chain and derivatives data support a bearish outlook, while technical analysis remains unfavorable.