|

GBP/USD Technical Analysis: Reclaiming the 1.3000 handle, but key Fibo levels remain

  • The GBP/USD remains pinned to the 1.3000 handle after Thursday's 250-someodd pip rise on refreshed Brexit hopes, and the pair remains pushed into near-term highs.

GBP/USD M5

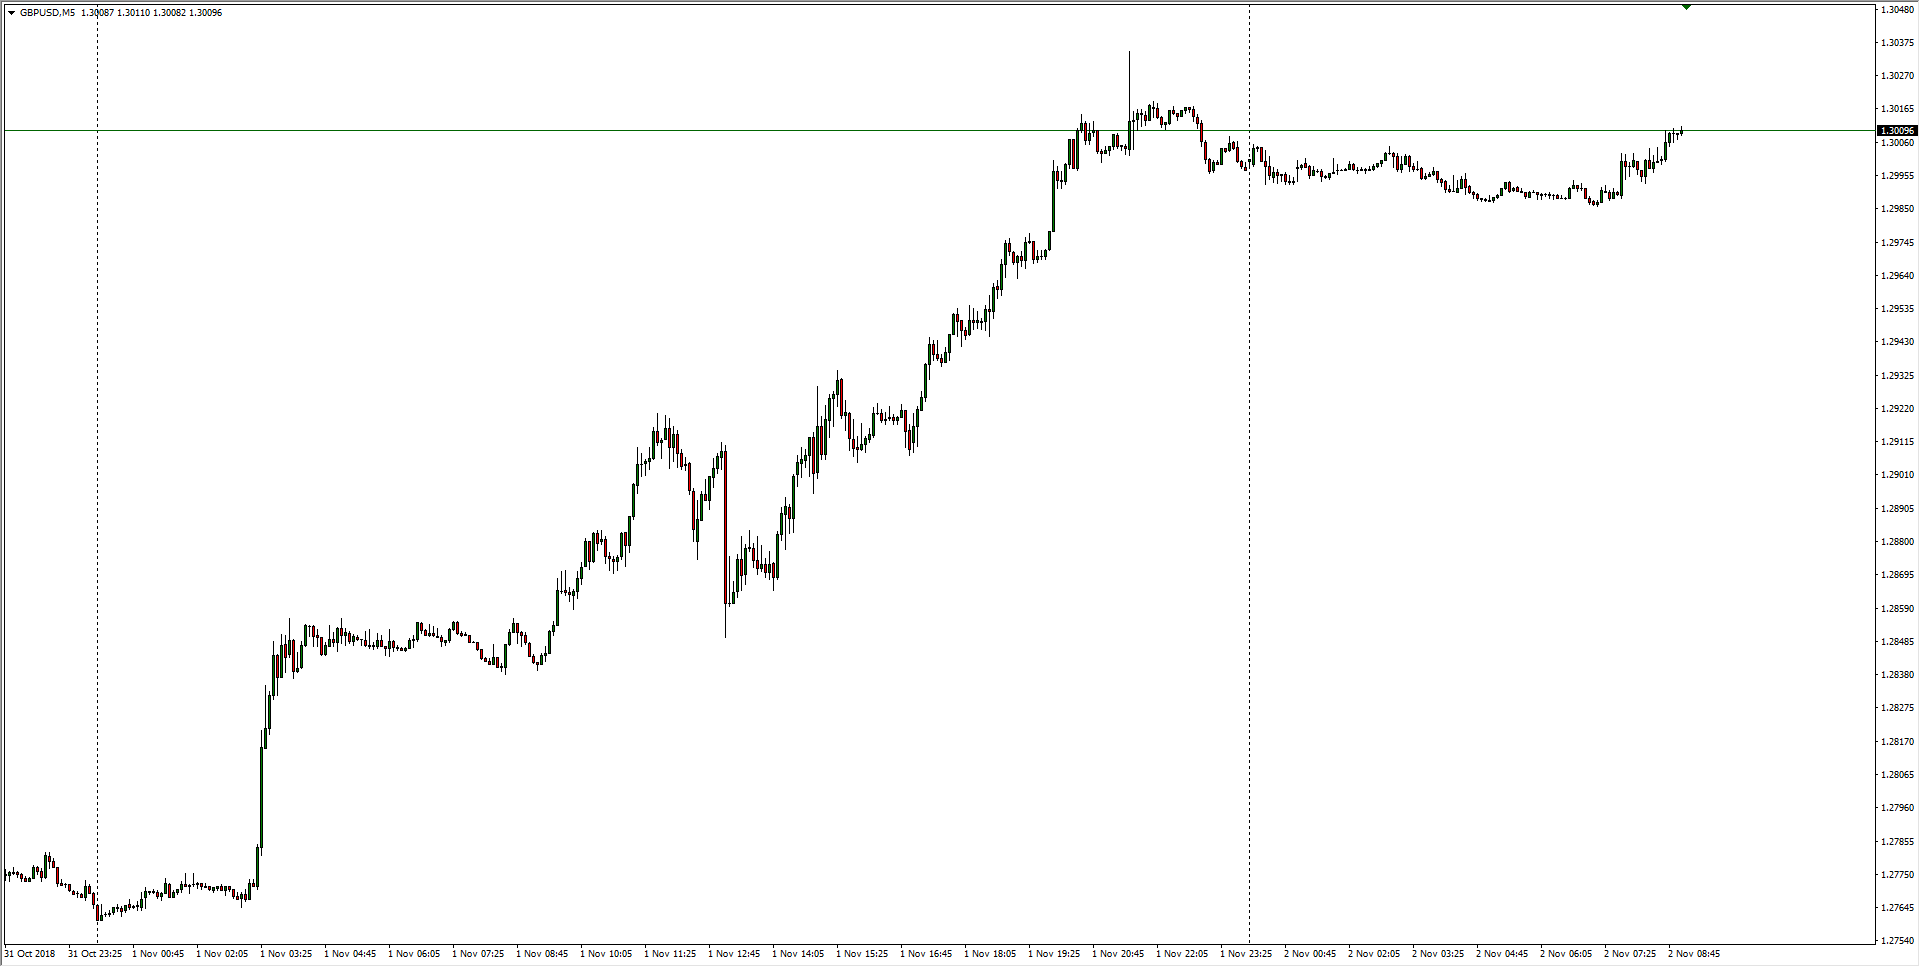
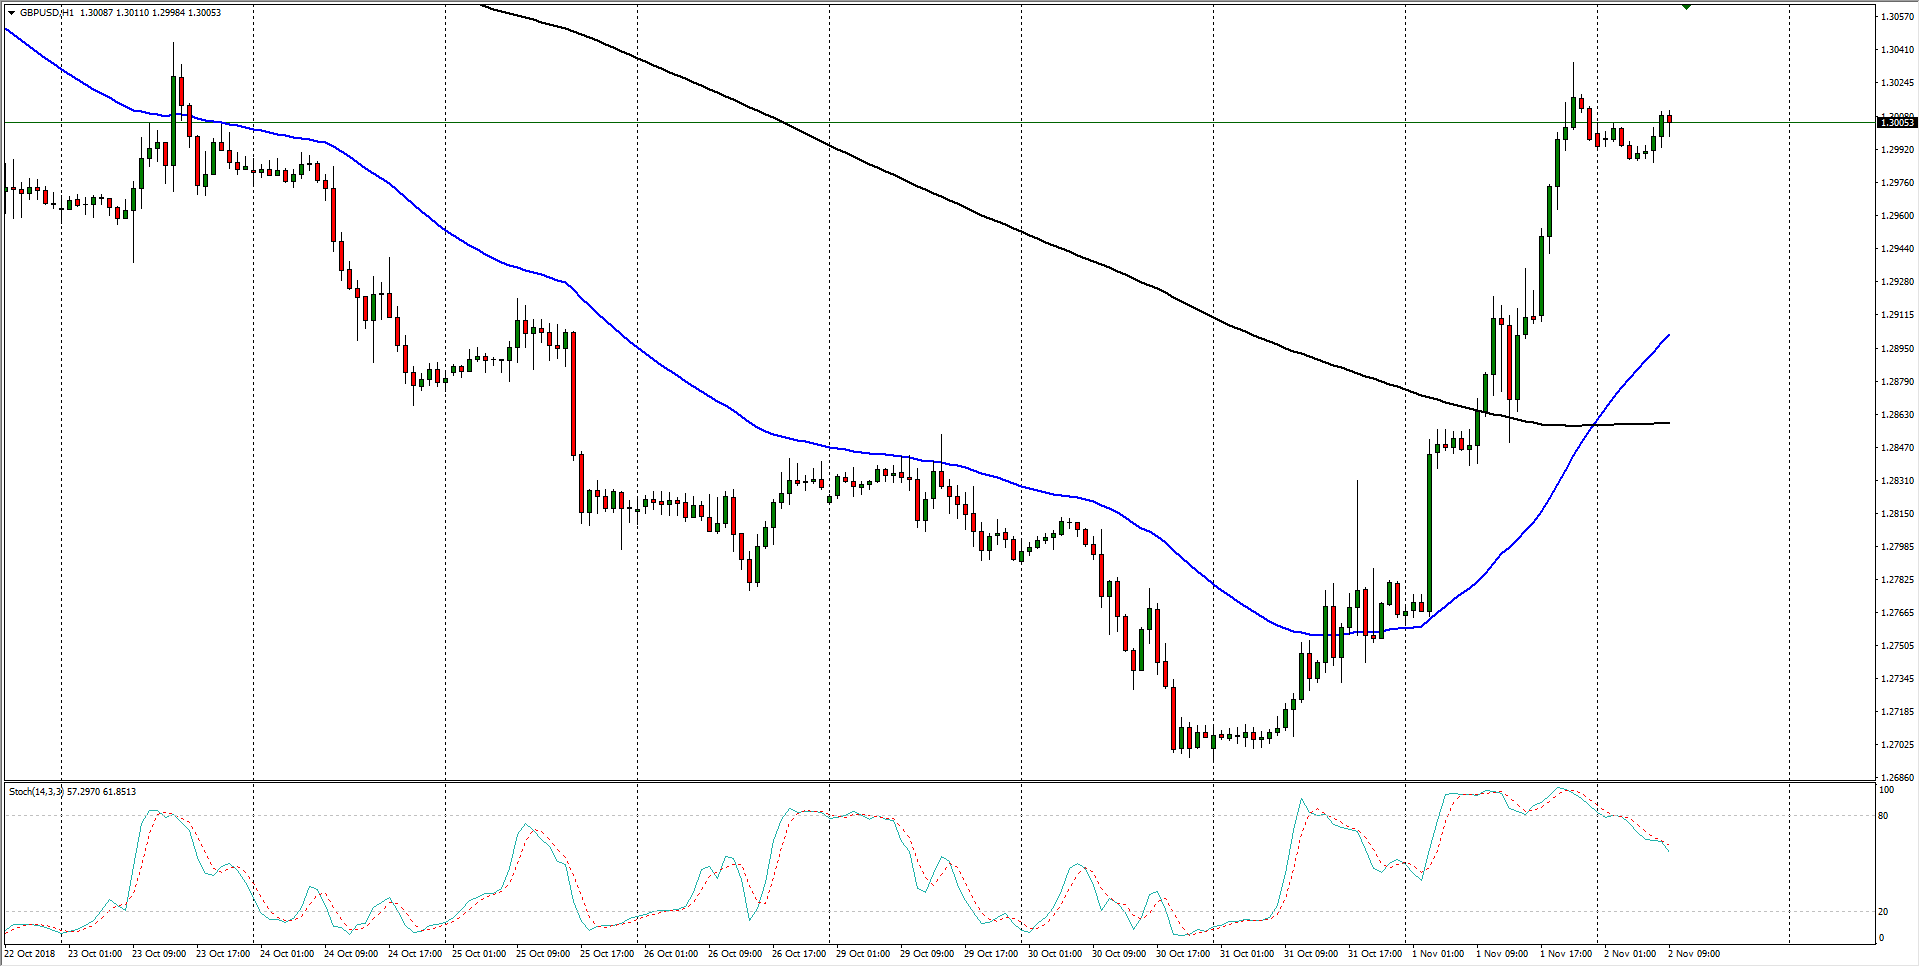
Hourly candles show the Cable has blown right past the 200-hour moving average at 1.2860, and the 50-hour moving average has inverted the pair's near-term bias, setting in a potential floor at the 1.2900 handle.

GBP/USD H1

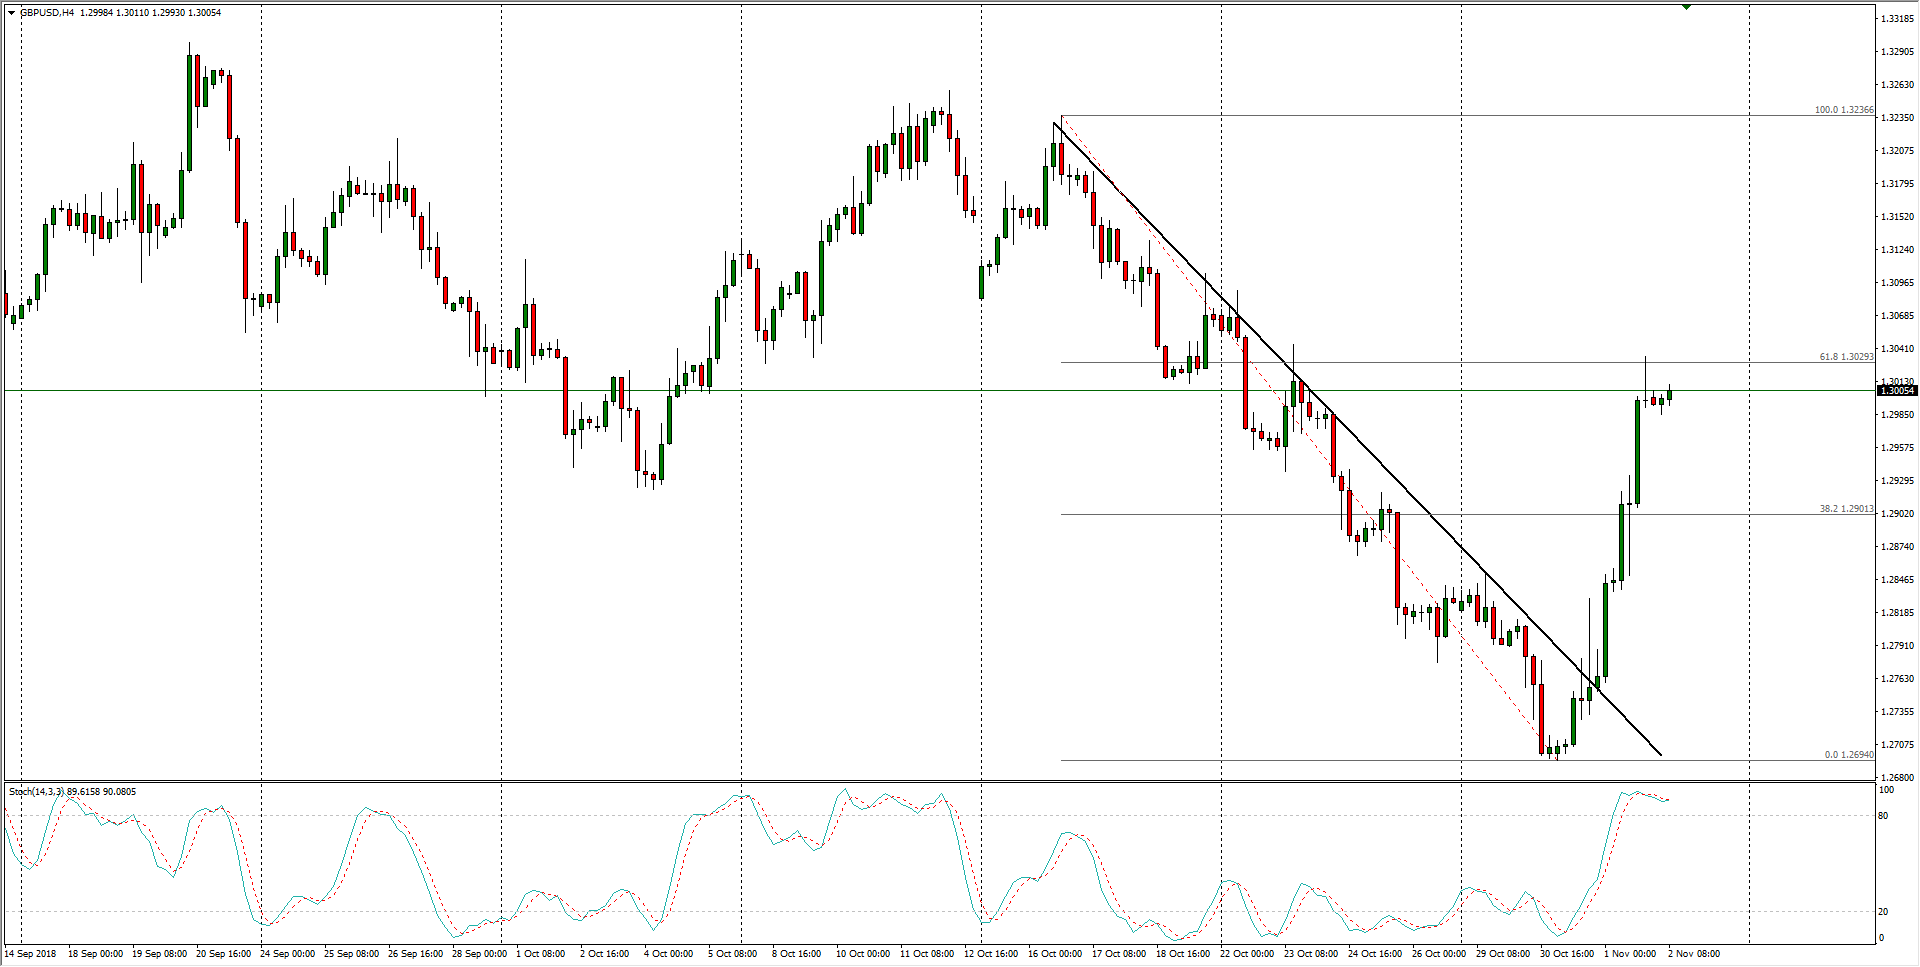
  • The past three weeks have seen the Cable steeply off of early October's highs, and yesterday's trendline break sees the GBP/USD making a clean challenge of the 61.8% Fibo level neat 1.3030, and buyers could see challenges heading into Friday's action.

GBP/USD H4

Don't forget to check out FXStreet's own live chart to see instant updates on the GBP/USD!

GBP/USD

Overview:
    Last Price: 1.3006
    Daily change: 1.0 pips
    Daily change: 0.00769%
    Daily Open: 1.3005
Trends:
    Daily SMA20: 1.3011
    Daily SMA50: 1.3019
    Daily SMA100: 1.3045
    Daily SMA200: 1.3436
Levels:
    Daily High: 1.3036
    Daily Low: 1.2762
    Weekly High: 1.3092
    Weekly Low: 1.2777
    Monthly High: 1.326
    Monthly Low: 1.2696
    Daily Fibonacci 38.2%: 1.2932
    Daily Fibonacci 61.8%: 1.2867
    Daily Pivot Point S1: 1.2833
    Daily Pivot Point S2: 1.266
    Daily Pivot Point S3: 1.2558
    Daily Pivot Point R1: 1.3107
    Daily Pivot Point R2: 1.3209
    Daily Pivot Point R3: 1.3382

Author

Joshua Gibson

Joshua joins the FXStreet team as an Economics and Finance double major from Vancouver Island University with twelve years' experience as an independent trader focusing on technical analysis.

More from Joshua Gibson
Share:

Editor's Picks

EUR/USD seems fragile below 1.1700 as Middle East war boosts energy prices

The EUR/USD pair trades flat at around 1.1680 during the Asian trading session on Tuesday, but broadly seems vulnerable, being close to its five-week low. The major currency pair is under pressure as surging oil prices due to the United States-Israel war with Iran have increased the risks of higher inflation for the Old Continent.

GBP/USD hovers around 1.3400 with bearish pressure intact

GBP/USD edges higher after three days of losses, trading around 1.3400 during the Asian hours on Tuesday. The technical analysis of the daily chart indicates an ongoing bearish bias, as the pair trades within a descending channel pattern.

Gold stays bullish as Iran war continues to spur safe-haven flows

Gold is finding renewed bids in Asian trades on Tuesday, making another attempt to regain the $5,400 level amid persistent demand for safe-haven assets as the Iran war extends. A softer risk tone remains in play as US President Donald Trump continues to threaten deeper escalation to the ongoing war with Iran, warning that a “big wave” is yet to come.

Top Crypto Gainers: Near Protocol, Virtuals Protocol, and Morpho lead market recovery

Near Protocol, Virtuals Protocol, and Morpho are leading the market recovery with double-digit gains over the last 24 hours. Technically, NEAR extends the breakout of the falling channel pattern, VIRTUAL holds above the 50-day EMA, while MORPHO tests a crucial resistance. 

The market is not panicking it is repricing the probability distribution of Oil and time

At the end of the day, markets do not trade morality or geopolitics. They trade transmission channels. And the only channel that truly matters in this maelstrom runs through the price of energy and the time value of money.

Grass 20% bullish breakout defies broader market weakness

Grass (GRASS) is edging up above $0.30 at the time of writing on Monday. The token’s notable 20% intraday surge stands out amid heightened volatility in the broader crypto market.